Anyway, I traded gold mostly and the majority of my entries were pretty good. The first trade I took a short scalp of 12 ticks, but price fell another 60 ticks right into a demand zone. I took a long at the zone and held for 15 ticks and it zoomed another 80 ticks. In between I scalped both trend and counter trend. I really need to stop counter trending scalp as they are too stressful.
After gold slowed down I wandered into the Oil charts and took a counter trend trade, but this was at a minor supply zone. However, price broke through the zone and I was quickly in a hole. However, I am becoming good at spotting short term momentum exhaustion and was able to average down and made a little profit out of it.
I feel like a golfer who has problems with his driving and continually getting into bunkers. But because he has had a lot of experience in the bunkers, he is able to recover on most occasions. However, I don't want to keep visiting the bunkers as I know that one of them will be my downfall eventually. So until, I can learn to accept losses, I am still unwilling to commit my live account to the dangers of day trading.
If I had been looking on my 15 min chart, I would not have taken the CT trade as there was a better supply level above and that is where I should have taken it.
While trading gold, I missed a very good long entry on Oil. It was at an extremely good level formed this morning where we had a lot of HVC bars basing and then had an impulsive move out, so when price returned later in the afternoon it went into the zone on a climactic volume bar and bounce out up to the supply zone I referred to earlier. This bounce was about 160 ticks.
So I really need to get up earlier and identify potential supply and demand zones and have alerts for when price is at those levels.
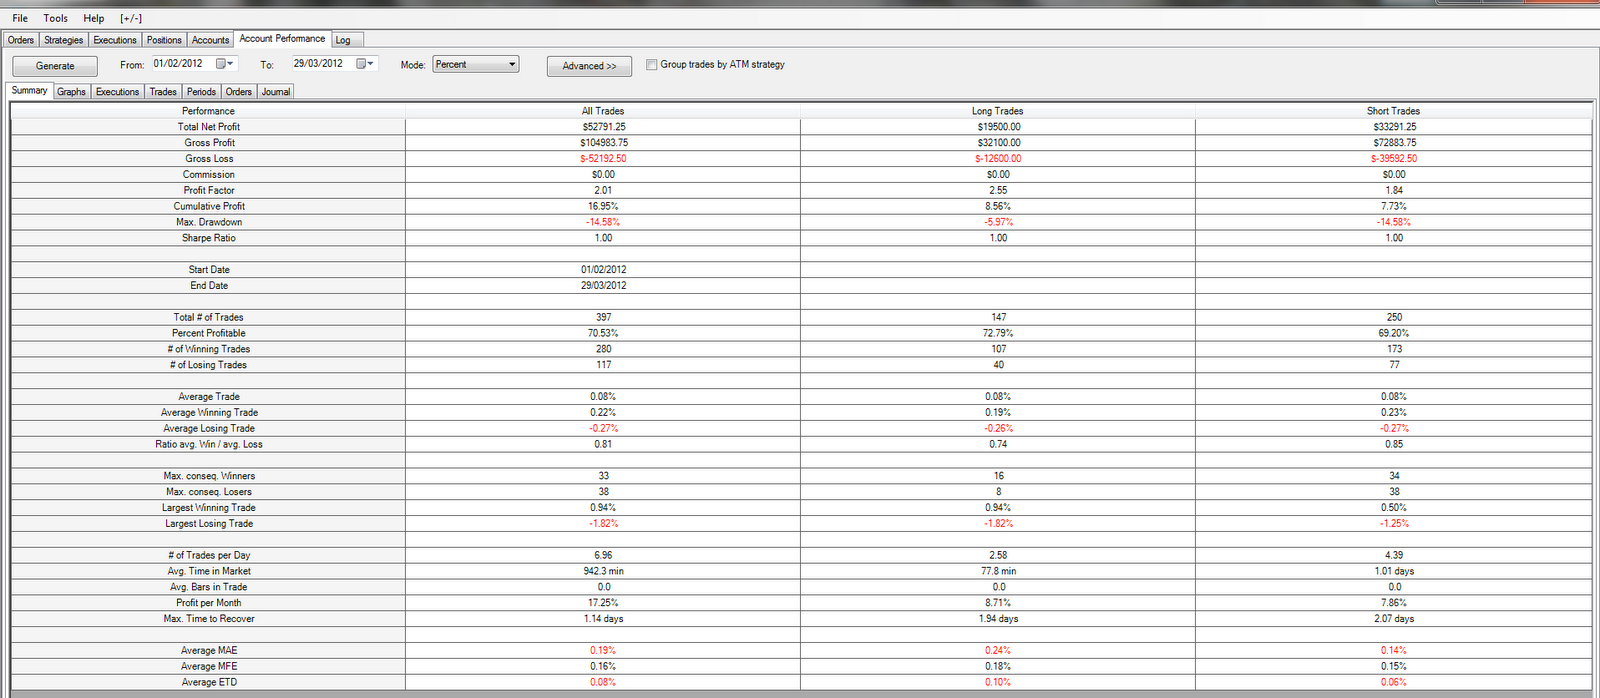
I looked at my monthly Sim summary and although I made a large profit the MAE and max drawdon were too large. On the positive side, my win to loss ratio was around 70%.
I started this sim account at the beginning of August 2011 with $100K and was surprised that it had grown to $689K and my win to loss ratio was 74%. The MAE was not too bad, but the max drawdown was horrible.
I am going to reset my Sim account to $25K and see how I trade this month. But as I am still averaging down, I am not going to trade live until I can cut out the bad behaviour.
I have attached the 15 min CL chart to show the good demand level from this morning and the summaries and equity curve graphs for February and since August.


No comments:
Post a Comment