Monday 25 June 2012

Today's Gold analysis

On my last gold analysis, I said I saw buying coming into this market and expected the up move to continue and to buy the dips today.  Well, this was the case.  After a corrective down move from Friday's high, we formed a demand zone on the smaller charts and rallied $22 up to the first supply zone near 1590 that I had identified in my last post.

The rally was on low volume as I expected, but I still think price will continue up to around the 1600 - 1605 level.  After that, I will have to assess if this is just another stop hunt by the MM, taking out the SLs of the short traders before crashing further down, or that genuine demand is coming in.

Here are the charts


Today's Trade

Today I was nearly bored to tears waiting for a long set up when price retraced back to a really good demand level on the 1K tick chart which was formed on Friday afternoon, where we had a very impulsive move up with lots of RPM bars leading to a 200 tick rally into Friday's close.

I waited for over 4 hours, but in the end my patience paid off.  I scaled into the trade, and as usual my first entry was too early, but my second entry was almost perfect.  I was nearly stopped out as price missed my SL by 1 tick.  I need to wait for confirmation of a trend change and then enter with a RPM signal to avoid taking unnecessary stop outs.  I am working on this aspect and will get better with more experience.

My first scale out was for 46 ticks, but I really should have done better with it and my second scale out was for 100 ticks just below a throwback supply zone, where price retraced, so it was a good exit. Price continued up later on, but I was very happy with the trade.

I took screenshots before, during and after the trade to show how I identified, entered and exited.

I did not look at another instrument whilst waiting for the set up to arrive and missed some nice trades on them, especially Gold, where I was looking to buy the dip today (see my last gold analysis).  But I am pleased that I was patient and I will continue my focus on CL this week. The good thing was that I was never tempted to take a counter trend scalp.

Here are the charts


Sunday 24 June 2012

S&D levels for Trading CL tomorrow

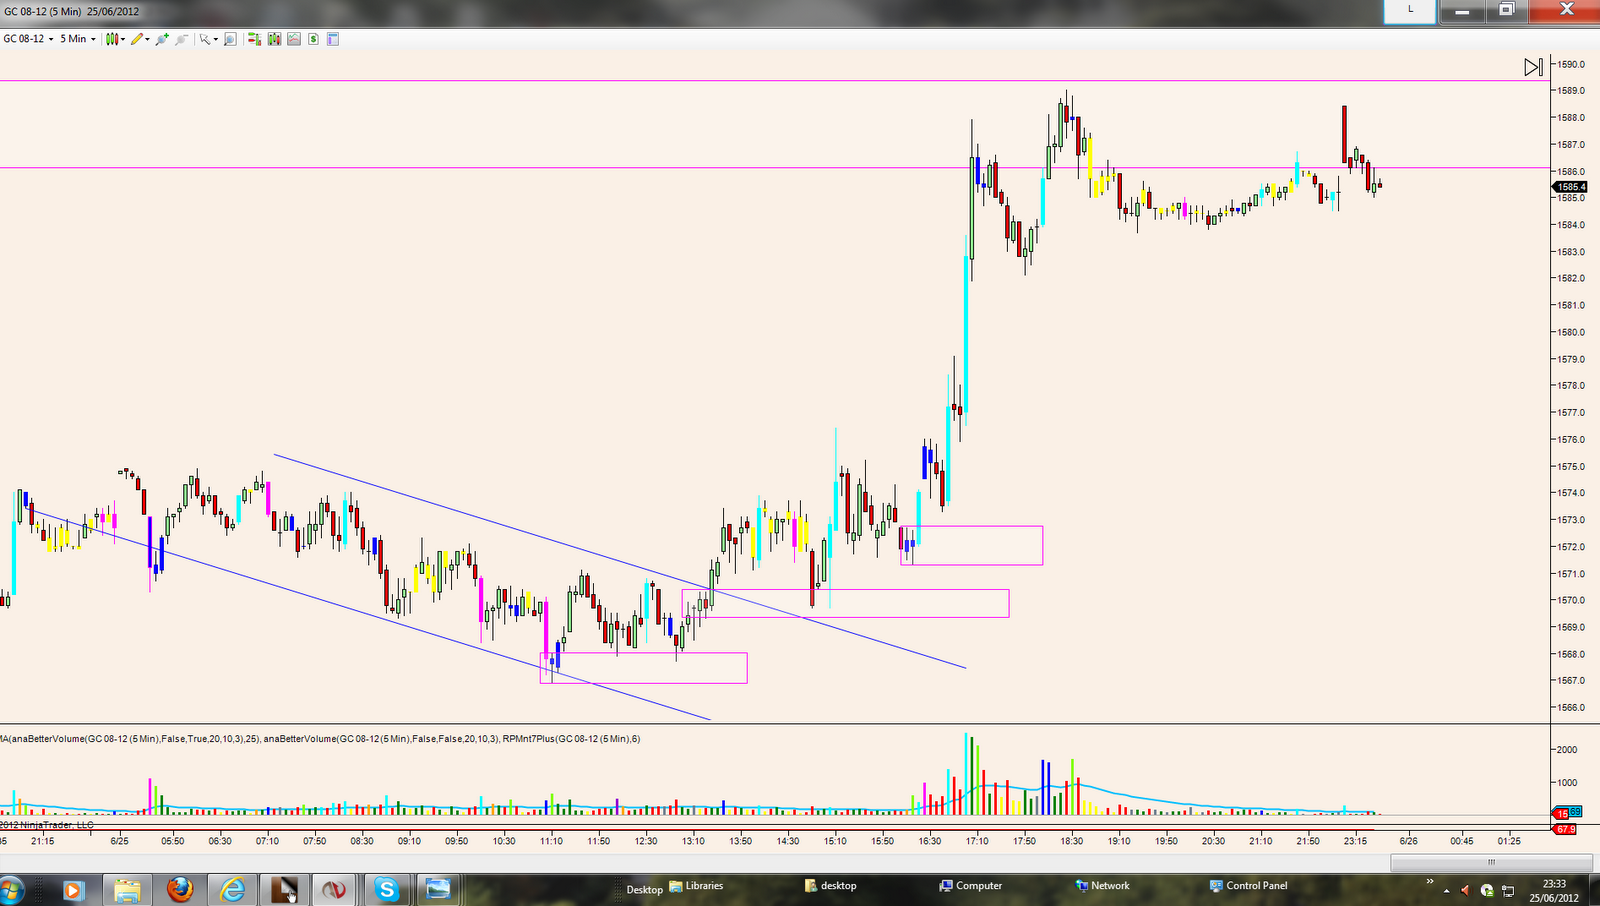
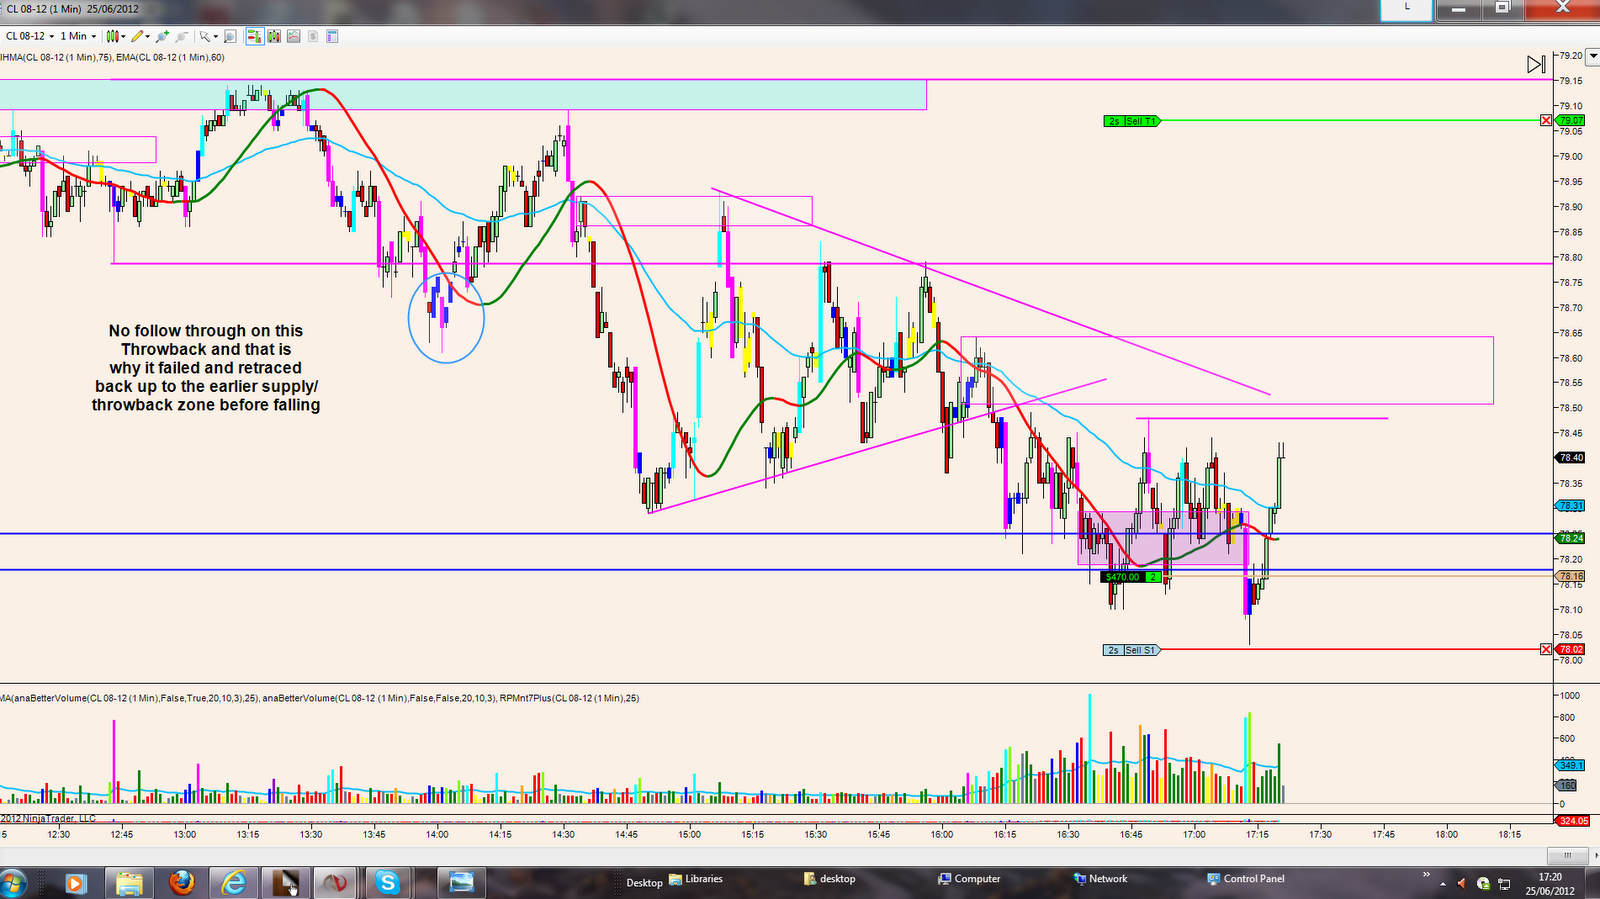
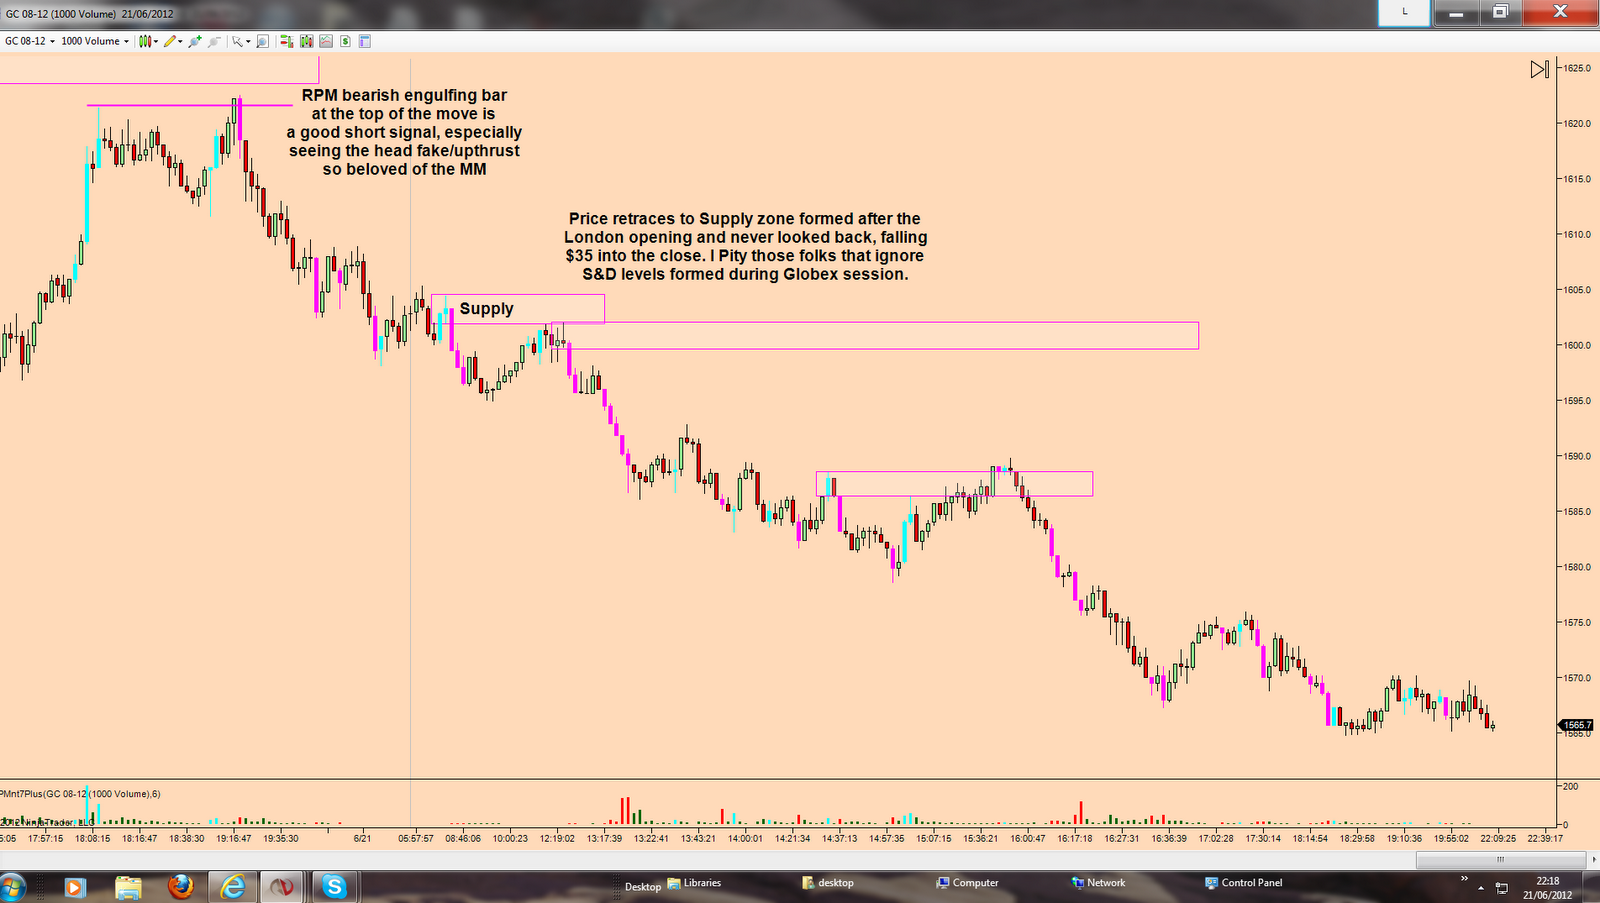
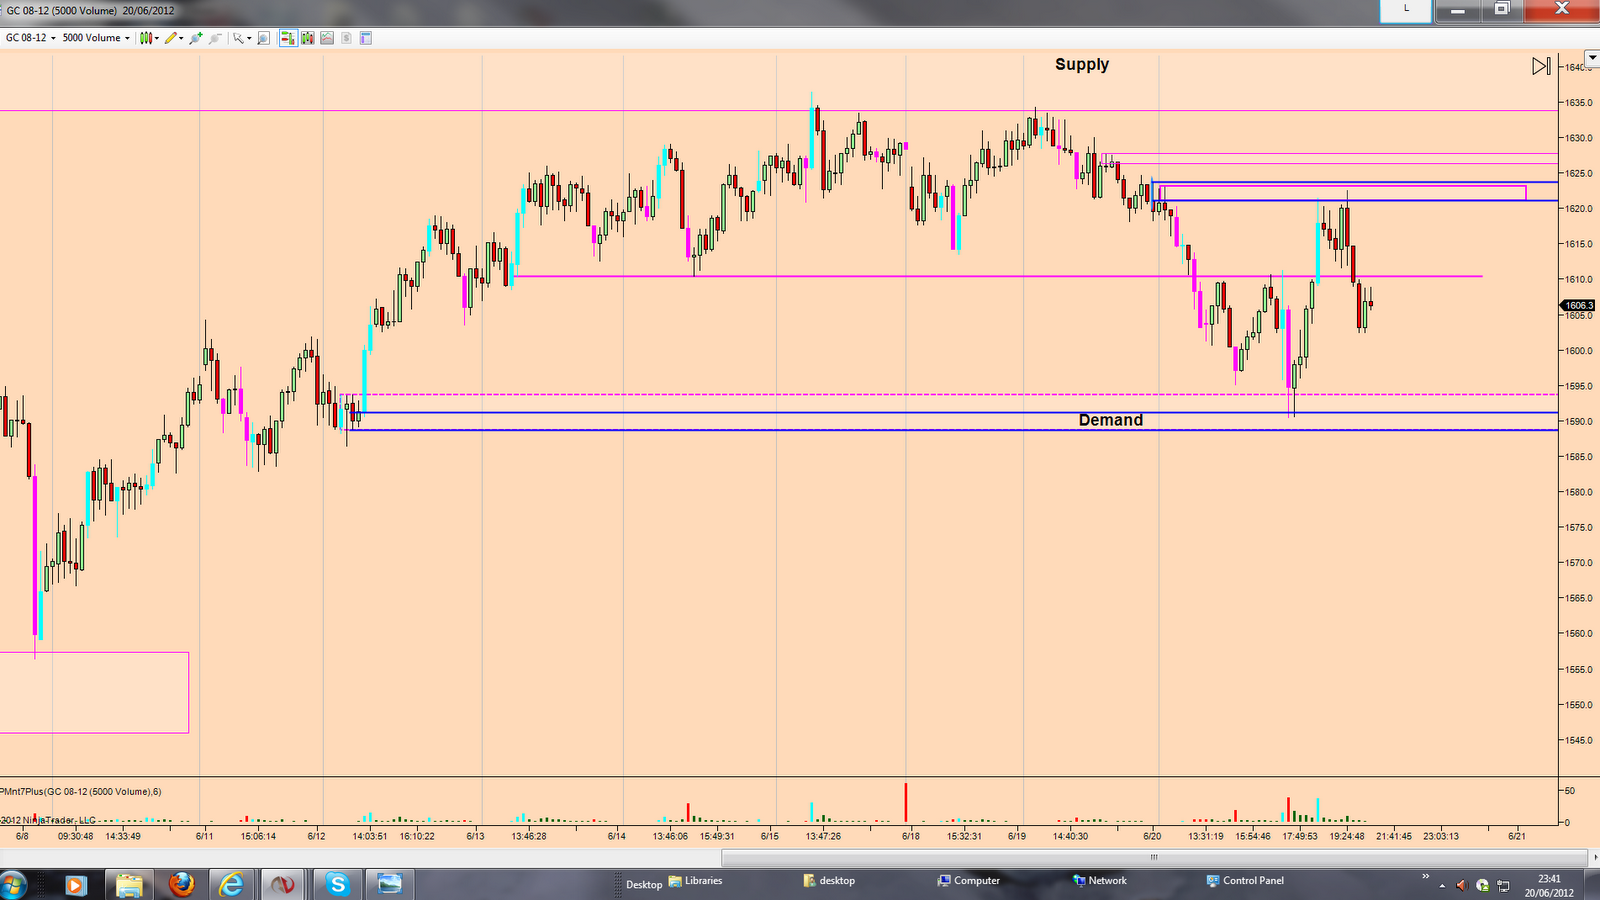
I have attached some charts identifying S&D zones on CL that I will be looking to trade from tomorrow and in the coming days.  You will notice the different chart types and chart sizes.

I try and trade too many pairs and end up missing too many good moves as you will have read in some of my previous posts. So this week, I am going to only focus on CL, and, only look to take trades at the better zones, i.e ones where there has been strong moves away from a possible S&D zone with RPM bars.  This should stop my preponderance of taking stupid counter trend scalps

However, I will continue to carry out my end of day hindsight analysis on the other instruments to continue my education of how price moves on each of them.

As an intraday trader, I concentrate on levels formed on the day or from the previous day using the 1K and 500 tick and volume charts and also the 5 min chart.  However, recently, I have been looking further afield using a bigger Volume and Tick chart (5K) to get S&D zones.  From now on, I will also use the 4hr and 1 hr charts and the daily charts to get a bigger picture overview.

By looking on the smaller time based charts and smaller tick and volume charts (500 and 1K for both), I have 'tunnel vision' and miss out on seeing important price action that is available on the 4hr and 1 hr charts, especially corrective moves back into a good S&D zone.  .

By carrying out this analysis today, it became very obvious that the larger timebased charts are better than the small tick and volume charts for seeing corrective moves back into S&D zones.

Although, I trade counter trend, when the opportunity offers themselves, I prefer to trade in the direction of the impulsive moves and against the corrective moves (except when I take stupid CT scalps) as there is a higher probability of the trade working and also have a larger profit potential.

So this is the way forward for me.

Nb, using the daily chart, I could see why we had a bounce up of 280 ticks on Friday, as it was the swing low from last October.

So here are the charts with zones I will be looking at tomorrow.


Saturday 23 June 2012

Weekly Gold Analysis

Last week, I believed that price would break above the supply zone and push on to the 1700 level, but the consolidation we had seen for several days, was on low volume and turned out to be distribution rather than absorption as I had originally thought.  We then had the massive sell off into Friday morning and price turned at the demand level from the climax selling seen on 8 June.  I did identify this level on my last analysis. I also had a buy trade at that level, but did not hold it long enough.

I have not used the daily chart for any of my analysis so far, as the it is corrupted on the Ninja Trader platform, so today, I used the 1440 min chart to see the daily price action. From this I could see that the supply level was still a very strong level and the retrace back to it was on very low volume, so with this, I would have been looking for a fall in price rather than a break of the supply level.  So from now on, I will use the 1140 min chart in all my weekly analysis.

Back to yesterday's price action.  We had a large move up from the London open, just above the June 8 demand zone, and then we had a very large climax volume bar on the 5 min chart, but price just went sideways for 4 hours.  On the 1K tick chart we had a lot of HVC bars clustering and then price fell back into the earlier demand zone.

We then had another large volume bar at the demand zone and price rallied over $14 after this. So this demand level from the 8 June was important as I had said yesterday.  If it is broken, then we should see price go down to the 1530 level.

The HVC clustering looks like buyers were absorbing the supply at that zone, before price fell from the level. So now that this level has been broken, I expect the rally to continue, probably back to the 1590 - 1600 level.  If it is on low volume, then I would expect another large fall to the 1530 level.

So for Monday, I am looking to buy the dips.

Here are the charts


Thursday 21 June 2012

Today's gold analysis

Yesterday I noted on one of the charts, that anyone still holding on to losing longs would be feeling a lot of pain today, and suffered they did.  And the suffering will continue tomorrow if they have not covered their longs yet.

Gold started falling this morning after a supply zone was formed after a buying climax seen on the smaller charts.  This zone was formed soon after thye London open and price retraced to the zone about 4 hrs later and stareted falling from there, and kept falling all day for a $35 high to low.

I pity anyone who say's that trading during the Globex session is irrelevant, as they will miss major S&D zones as seen today and yesterday, and on most days.

There were 2 demand zones from the 5k Vol chart, but they were not very good looking, however, they did offer tradeable bounces. The first was a $11 bounce and the second was $8.

The demand zone from yesterday was broken with RPM bars and as usual, price retraced back to the level for a throwback trade and fell $24 after that. In fact there were 2 throwback opportunities, with the first one offering a $11 trade down to first demand zone from the 5K chart formed on 8 June.

So the next level to look at will be the low from that selling climax on 8 June and then the NFP low.

The distribution I mentioned on Tuesday will stay in the background as weakness until we get a climax selling or aggressive buying on large volume.  So for the timebeing look to short on the rallies if you want to have a swing trade. But intraday traders can trade in both directions.

Here are the charts


Today's trades

I only took 2 trades today. The first was a short to try and get into a new trend. I was premature and closed with a 5 tick loss after price was going no where. I then missed a very good RPM signal to re-enter short, and after that, CL fell for the rest of the day.

I made my money back on CL later with a CT scalp on 2 contracts.  I still do not understand why I contemplate CT scalp trades, when there are so many good trend re-engagement trades identified by the RPM, which gets you in profit quickly and more importantly, stay in profit.


Wednesday 20 June 2012

Today's Gold Analysis

Well, what a day.  And it appear that my assumption that the consolidation on low volume over the last 5 days was distribution rather than absorption was correct.  You will also notice where the down move ended, was at the fresh demand zone I had identified on the 60 minute chart from yesterday.

My gold trades today were mainly longs, but these were taken before price  had hit the demand zone and I was finished trading by the time it had.  But I was watching the charts at the time and was twitching with my hands hovering over the mouse wanting to take a long trade, but as I did not want to spoil a very good day, I declined the temptation to go long.  Damn, price bounced up $30 from the demand zone. This is just so frustrating. But there will be more opportunities tomorrow.

Here are the charts


Today's trades

I traded quite well today. I took 3 GC and 2 ES trades. Two of the GC trades I scaled into them. Overall the average ticks per contract on the multi contract trades were 27 ticks for both trades.
I took 7 ticks on a CT scalp on GC and two on ES (yes I know I shouldn't, but I still cannot help myself).  So with averaging the 2 multi trades, I took 70 ticks today.

I am still not holding on to my trades long enough.  On the first trade, the largest value was 33 ticks and 40 on the second multi lot trade.  So there is still more to work on.

No losing trades today, so not too bad.

Here are the gold trades.


Tuesday 19 June 2012

Today's Gold analysis

As stated in my trades review, I saw a buying climax into a supply zone, so was expecting a down day. And this came to be.

My prediction of price breaking above the supply zone is looking less likely to happen any time soon.  Price has been stuck in a $25 range for 5 days, and we should expect a break out, but I am re-thinking my opinion that it will be to the upside.

The reason, is that over the 5 days of basing, the volume has been low, and this could indicate that we have distribution rather than absorption.  Unfortunately, we won't know until after the event. 

Maybe today was another shakeout before the big move up.  Who knows (perhaps the MM do, but they are not letting on).

So on a daily basis, I will trade what I see rather than let my bias sway me.


Today's Trades

Today I had a good day . 1 had 7 trades, 2 losers and 5 winners. However, I am still taking CT scalps even though I have said on many occasions that I would not. They offer very little reward for the effort and have a lesser probability  to win. The 2 CT scalps I took, 1 win 1 loss.  I Came out $15 up on them.

Anyway to the other trades.  Gold was my main focus today and I took 3 trades with 2 winners.  I had seen what appeared to be the buying climax into a supply level, so I was looking for supply zones to short, I saw a HVC zone formed and price broke out to the downside, so I got short on the retrace at a throwback line. I should have waited for price to retrace back into the supply zone.  So I lost the first trade for 14 ticks.  I re-entered the short as soon as I was stopped out and held it for 46 ticks just before a demand zone from yesterday.  Price retraced back to the supply zone, and I hesitated about taking another short and missed the opportunity for another 70 ticks.

Another supply zone was formed on the down move I missed, and a very good looking one it was too. When price retraced, I got short, with only a 10 tick SL. Price moved down 30 ticks very quickly then stalled at a swing point and I decided to close for 28 ticks.  This was a very bad move as price soon moved down very fast for another 40 ticks.  I need to hold onto trend trades and not be shaken out so easily. In fact if I had held on to this trade, it would have earned over 110 ticks.

So for gold, I traded in the right direction, but trade management needs improving.

I traded the Euro on the long side after price had gone to a demand zone. I took 21 ticks, but the damn thing kept on moving up for another 130 ticks. Bah Humbug.

The last trade I took was on TF.  After waiting all day to look for a good supply trade on either ES or NQ, I saw the perfect opportunity on TF at the high of day, when we had a HVC zone with price breaking to the down side. After price returned and bounced off the zone, I entered a short and took profit at a swing low for 39 ticks. When price retraced back up, I was going to enter another short as a new supply zone had been created on the down move, but I declined this and missed out another 40 ticks.

So quite a good day with over 100 ticks earned. I am seeing these supply and demand zones really well, but I need to manage my trades better and stop counter trend scalping.