Wednesday 29 February 2012

End of day analysis - 29 Feb 2012

I am very late with this, so I will let the charts do the talking.

I have been refining my Renko entry technique and have started writing down my 3 main method with chart examples.  I will try and concentrate on these tomorrow, but I will still need to be looking at my other charts as those also give important information.

I was going to take a live trade on Gold after seeing my favourite trend setup on the 6 Renko chart, but got cold feet due to the speed that gold moved today. Pity, I could have made a lot, or probably could have had a nice little scalp (which I did on Sim).


Another day, another fall from the wagon

Today I traded both Oil and Gold.  My trades on Gold were fine and my entries were exceptional except for one trade.  I caught the top of a $81 (810 ticks) move, but only held it for 13 ticks.  I had another entry based on my favourite Renko LV signal and pulled 12 ticks from what turned out to be a 180 tick move.

I traded Oil badly, and got on the wrong side of the move and kept averaging down, until I had 10 contracts on at the close of the trade.  Fortunately, I am very good at seeing trend exhaustion and was able to come out of the trade with a small profit after being in an extremely large drawdown.  Unfortunately this one trade made my summary look very bad, even though I made a large profit from my other trades.

I had a couple of 50 tick trades on Gold and several more of over 30 ticks. Later in the day, after the trend on Oil had changed, I got a very good entry based on another Renko signal using the RPMnt indicator and took another 14 ticks from what could have been a 100 tick trade.

So overall, my entries are very good and if I could only deal with a bad entry and take my stop, I would have had a good day.  But with me still reverting to type, I do not see this as a good day.

The irony of that bad trade, was that I was seeing some very good trend entries on my Renko charts, but could not take any of them as I was in a stupid counter trend trade.

So I suppose the good thing from this terrible trade is it teaches me to exit a bad trade as there is a better trend trade available.

I will post my EOD review later, but yesterday before closing my platform, I did an analysis on Gold and noticed a distribution pattern and thought that it may be time for a fall, but I was not expecting a $87 drop in price. 

When I opened my charts today at 13:30 GMT, I noticed the unusual high volume around 10:00 am  where we also had reversal climax churn bars, which were both HVCs.  I did notice the CCH bars and thought that it would be a down day based on the size of the reversal bar, but did not expect price to cut through every demand zone like a hot knife through butter..

I marked off a supply zone on the 15 minute chart which was a basing area with a couple of HVC bars where price had fallen impulsively.  So when price returned to the area, I shorted it but only held for 13 ticks.  and as we know, it fell very hard from that point.  So I really should have more faith in my chart reading analysis and try and go for the big daily wins, rather than the small scalps.

I am also looking at developing my entry technique using only the 6 tick Renko chart, with both the RPMnt and the VP indicator.  I have come across some very good patterns on the Renko and also can identify where we have a fakeout breakout.  So I will be concentrating on these tomorrow. 

So here is the not as bad as it looks daily summary.

Tuesday 28 February 2012

Falling off the wagon. Again!

I was back to my worst today, averaging down to get back to break even.  Fortunately, I seem
to be good at spotting exhaustion and was able to profit from bad trades.  So I am not
too angry with myself.  I am still improving with my chart reading, but my trade management
leave a lot to be desired.

I had a sleepless night last night and got up early but went back to bed and did not get up
until 4:30 pm (GMT), so, I really should not have traded today.  That is my excuse for bad entries anyway.

I have attached today's summary as another reminder of how not to trade and eventually these lessons will be learned.

I only traded Gold today, but wished I had traded Oil, as there was a great move from the
Market Makers (MM) again.  These people really know how to manipulate the market.

See the notes on both the 3 and 15 min charts.

Hopefully I will be better tomorrow.  No live trades taken today, only Sim.


Monday 27 February 2012

Who Needs Hindisght?

Each day, I do an end of day (EOD) analysis and mark off where the better entries are in hindsight, based on my entry methods.  See my previous post from earlier today when I took a scalp trade based on the buying climax into a supply zone.  If I had held on to it, then there was more than 100 ticks to be had on it. 

So I did not need hindsight to identify this opportunity. I am getting better at seeing these zones. All I need to do, is control my emotions and not hold on to bad trades.

You will see my entry on the 3 min chart. I also showed where the ideal VSA entry would be.

I also did EOD analysis on CL, even though I did not look at it today. I really love CL, so many good moves during the day. There was a great bounce off the demand zone created on Friday and we also saw the Market Makers at work with a buying climax breaking through supply to stop out all the shorts and triggering breakout longs, before slamming back down and causing pain to anyone not trading with a stop loss. Ouch!

There was some great entries using the 6 Renko chart, and as usual we had the 'M' shaped shakeout before a long took off. We need to keep an eye out for these. Nb, these 'M' and 'W' shakeouts are really butterfly patterns, so that is how I will refer to them from now on - i.e butterfly shakeouts. The last chart (150 ticks) shows the Butterfly shakeout.

It is now 12:30 AM and I am off to bed. Hopefully I will get up early enough to trade from the NYMEX and COMEX open.

So 2 scalp trades today and very little heat and 25 ticks. So my entries are getting better. Now I need to concentrate on trade management for the big trades.


Just Watching

I got up late today so decided to just watch the charts as I had missed a climax selling action on Gold. I took a couple of scalps. Both successful and would have made quite a lot if I did not exit too early.

Anyway, I decided to mainly watch today and make notes on the charts, so I am going to post these charts so you can see what I am looking for to enter trades. I will also post my daily summary.  The MAE is much better than ever.

My 2 trades were broken down as a trend re-engagement long and a counter trend short which was at a supply zone, so it was safer than my usual stupid CT trades.  The entry on both trades was nearly perfect. I only had 3 ticks of heat on the long and no heat on the short. 

I only took 12 ticks from the long and 13 ticks from the short. The long moved up to a minor supply level before retraceing back down.  But I could have had 35 ticks maximum on this.  The short as I write is still going down and was a possible 54 ticks back into a demand level.

It is only 16:45 Pm in Manchester (England), but I have stopped trading for the day.  I will return
later with my end of day (EOD) analysis.


Sunday 26 February 2012

Live trade explained

Here is the live trade I took on my real account on Friday.  I use NT7 for my analysis and take trades on my PFG Best account.  PFG Best provides the live data feed onto NT7.

The indicators I use are:

On 6 Renko chart - 34 HMA; 60 EMA; Volume patterns Indicator (VPI)
On 3 and 15 min charts - 34 HMA, Volume Patterns Indicator, Better Volume (BV).

Nb, I must thank Big Mike from BMT for creating a great resource as without it, I would not have these great indicators.  Also Fat Tails for bringing volume to life with his version of the Better Volume indicator.  Cunparis for creating his version of the Volume Pattern Indicator.  And also Barry Taylor from E-mini Watch.com for being the inspiration behind these indicators. 

To Sam Seiden, the main instructor at the 'Online Trading Academy' - OTA - XLT programme, for teaching me how to identify supply and demand on a chart.

But most of all a big thank you to Tom Williams (and a lesser extent to Gavin Holmes) for teaching me how to trade using volume (volume spread analysis - VSA).

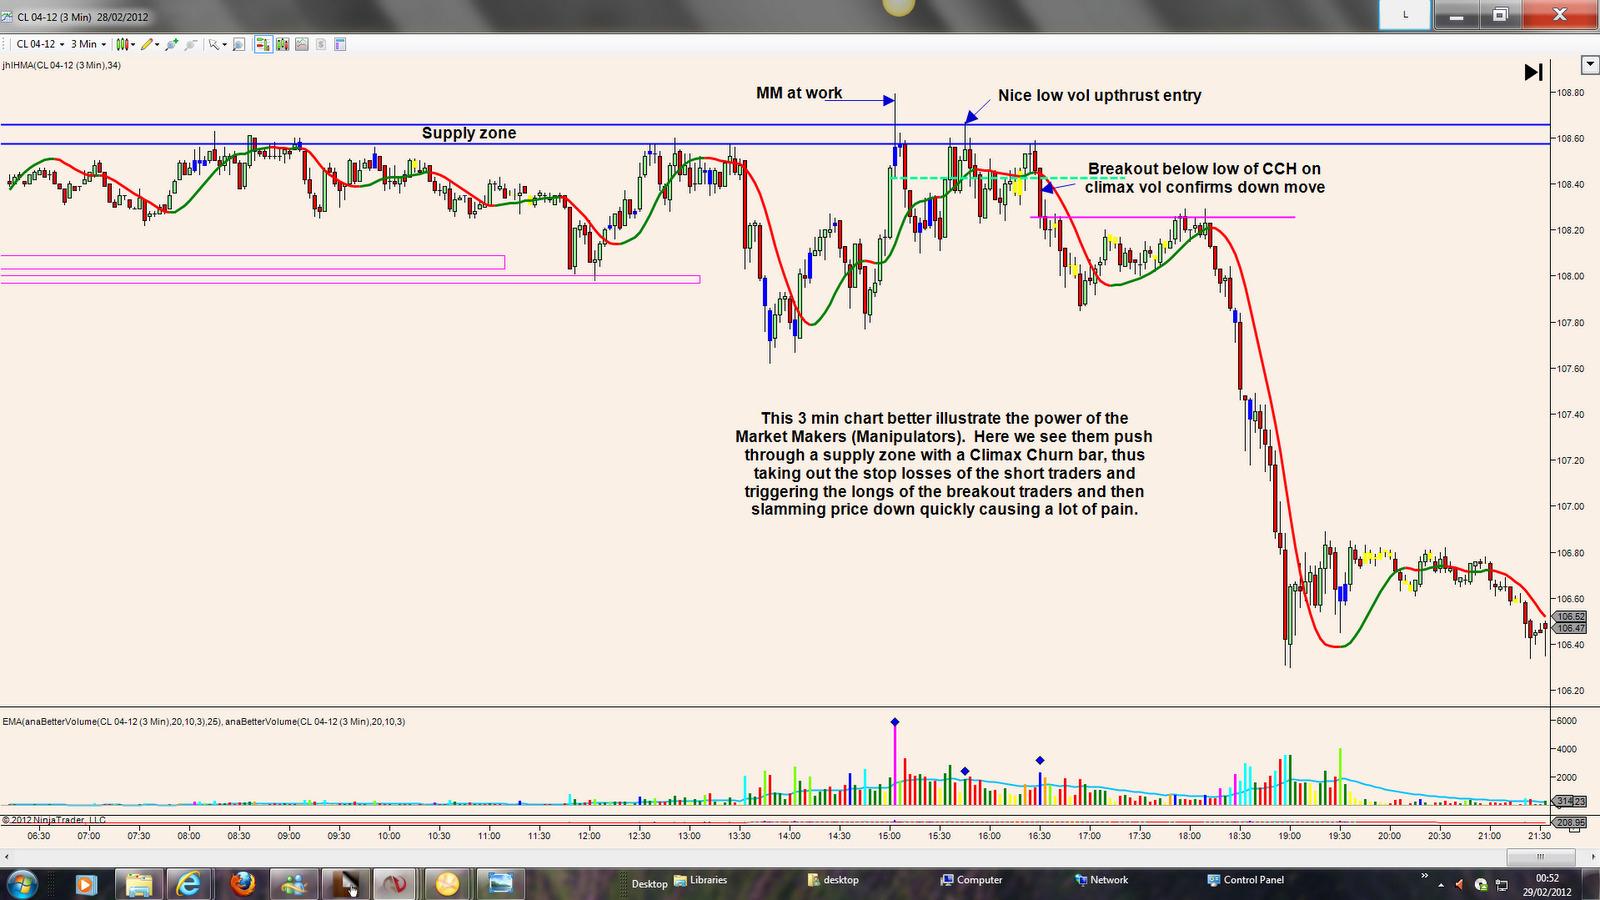
I have posted three charts to show what I look for in a change of trend (COT) trade.  The 3 minute and 15 minute charts alerted me to the possibility of the trend reverting back into an up move.  I also saw an area of basing on the 6 range Renko chart, and if price was going to go up, I needed to see a good break out of this area.  I also drew a box around a 15 minute churn bar and also needed a good break above it for confirmation.

I then look to enter on the Renko chart after a reverse bar.  I like to enter on the low volume bars (yellow bars created by the VPI) as these are a sign of momentum.  However, I entered too early, I really need to have more patience and wait for the shakeout to occur. I have noticed, these shakeouts usually look like an 'M' when going long (or 'W' when going short).

You will see on the Renko chart an extremely good 2 bar LV reversal which is the best signal for me.  However, as I was in the trade too early, and had become emotional, I ignored the signal, even though I saw it developing.

So by entering too early, I missed out on taking a good chunk of a 150 ticks move.

So what did I learn from this trade?

1 - Have more patience and wait for the shakeout, and a successful test.
2 - Pay attention to what the chart is telling me and not exit when a good signal is seen.
3 - Try not to get too emotional in a trade and take my losses like a seasoned trader.

I find my chart reading skill is improving week on week and using volume, especially climactic volume, I am better able to see a directional change.  However, I need to practice patience and wait for the shakeout before entering.  And be comfortable of missing a trade if it moves too quickly.  I believe it is the fear of missing out which is currently leading to my premature entries.  Fear of losing is also keeping me in a losing trade too long with the added problem of doubling down.


Falling off the wagon

Despite vowing not to repeat my bad habit of increasing my stop loss and doubling/quadrupling down, I am still doing it.  Fortunately while I am on Sim, it is not hurting my live account.  But it is having a detrimental effect on my psychology.  I did it on two occasions this week and my weekly summary looks horrendous.  So unless I can stop this character defect, I am not going to fully commit my real account to the hazard of the market.

I only made one live trade on my real account this week.  I waited patiently for price to reverse back into the up trend on oil.  Once I had confirmed that price was going up again, I entered one contract, but price reversed exactly at my entry and retraced 22 ticks.  My heart rate went up as I sweated profusely hoping that the trade would come back to break even, so I could exit. 

After waiting what seem like an eternity, price eventually came back and I exited for a profit of 1 tick to cover my commision and then watched open mouthed as price moved up another 150 ticks without me. 

The sad part of this trade was that there was a buy signal just before I exited, but I was blind to it because I had become emotional and was just hoping for a break even trade.  So despite having correctly analysing the direction of price, I am still not making any money.

This is really getting to me and I am losing confidence in my ability to make a living from trading.

I will continue sim trading until I can cut out the bad habits and from next week, I will not move my stop loss or double down.  If I can do this for 2 weeks, then I will start commiting my real account to the market.

I will post my live trade on my next post to show what I look for when taking the trade.

So after starting the week quite well, I succumbed to my weakness.  I will learn from these mistakes and improve as a trader and as a person.

I am attaching this weeks summary to remind me of the horrors of surrendering to my bad habits.


Tuesday 21 February 2012

Better trading today

Today I traded better than I did on Friday.  I allowed my stop loss to be hit without moving or deleting it.  Hopefully that will be the first step to not doubling down.

My first trade was a Change of trend after a climax bar.  However, I was early and was stopped out for 10 ticks.  Although it was a loser, and the entry was not particularly good, I was happy that I did not increase my stop loss.  I was then able to make a better entry on my second trade.  However, I exited too early.  I had 2 lots on this trade and should have only exited one and let the other run.

I then took a third trade and made 27 ticks on my second position after exiting the first earlier.  As it turned out, I exited my last position at the right place as price did not reverse, but was in a retrace and subsequently reversed back into the previous trend.  But as I was only looking for shorts, I missed the signal to get back into the long trend.

As I continue my learning process, I will hopefully not let my bias prevent me from seeing what is occuring on the charts.

The previous trades were on gold.  I then took a couple of counter trend scalps on oil after seeing climactic action.  The first trade was a little early, which made me close prematurely.  The second trade was a good entry, but again exited too early and could have got 30 ticks from it.

My chart reading skills are developing and I am carrying out end of day analysis on the charts showing where the better entries would be.  As both gold and oil, tend to have good daily ranges and will have big moves in any direction, I am looking to perfect my trend re-engagement technique to get the big trades, and I have been identifying the best entries on the Renko chart.  So hopefully, over the next few days, I will take some trades with this technique.

I did not take any trades on my live account today, which is a pity.

Here is today's summary.

Friday 17 February 2012

Same Mistakes Again

Today I did what I promised not to do again.  That is to trade without a stop loss and adding (doubling down) to a losing trade.  This occurred on Gold.  I saw a trend change take place but I thought (wrongly) that it was just a retrace and that we would go back in the up trend.  So when I saw price moving back up in an impulsive manner, I took a long and went into profit about 10 ticks and was feeling good about the trade. 

However, the trade began to go against me and I started to add more lots.  The draw down became larger and larger and the trade would not go back to break even on the retraces.  Fortunately, I spotted what I believed to be a high probability demand area from yesterday and added some more lots.  This co-incided with a climactic bar so I thought it would at least get me back to break even.  And I was right this time.  Phew.

Not only did it get me back to break even, I actually made some profit on it and exited at a supply area, whereupon, price fell another 100 ticks.  I really should have re-joined the downtrend here and at least make a good trade, after seeing a sell signal.

I also took a buy scalp, after I saw exhaustion in the down trend, but only took 5 ticks and watched price go up another 50 ticks.

The above trade was on Sim, but I did make a trade on my live account, which, fortunately was in the direction of the down trend, after I realised that my sim trade was wrong.  However, I closed too early when price started to retrace and only took 5 ticks and watched as price fell another 110 ticks from my exit. Blast and damnation.  I still get it wrong, even when I trade in the right direction.

When am I ever going to learn?

Hopefully, the lessons learned from these bad trades will eventually get through my thick skull and one day, I may become the Trader I want to be.


Thursday 16 February 2012

Fourth post

Today, I took a couple of Change of Trend (COT) trades.  One each on Oil and Gold and some counter trend (CT) scalps.  I do not know why I take CT scalps as trend re-engageents are much better and less stressful, but I digress.

I have attached a couple of charts to show the COT trades, but the gist was that I entered too early on the Gold trade and had to sit through 40 ticks of heat (yes, I did not use a stop loss even though I know it is wrong).  I will concentrate on taking more time on my entries for COT trades.  Again, as I entered too early and also scaled in (doubled down), I exited far too early and watched gold move another 200 ticks.

My entry on the oil trade was perfect and I did not take even 1 tick of heat, but only held on for 7 ticks.  When will I learn?

On a brighter note, I scalped 15 ticks on my live account today, so not all bad.

Here is today's summary. As you can see the MAE is not very good because of going into a large loss on the COT gold trade.


Wednesday 15 February 2012

Third Post

I seem to have deleted my first post by mistake.  To summarise it:

I have been trading futures since April 2011, however, I am still learning, especially from my mistakes.  I am doing most of my trading on a simulation account on Ninja Trader (NT7) but take the occasional 'live' trade on my real account.

I have only had one losing day on my live account, but unfortunately it nearly wiped out all my previous profit, due to taking off my stop loss and adding more contracts to a losing trade. This is what all newbies usually do. Anyway, my real trades since then have been winners, but I am only scalping 6 to 10 ticks and not taking the big trades.

So, I need to start sticking to my stop loss and not to add to a losing trade.  Easier said than done.

My sim trades entries are improving, but I am still getting in too early and having to sit through too much heat and then closing the trade soon after it goes into profit. Too often I have a good entry and the trades would have got 100 ticks, but I exit with 10 to 20 ticks instead.  I need to improve on my trade management.

So to today's trades (day 3). I only traded Gold today as I believe it is easier to trade when you are focusing on one instrument rather than multiple ones.

My first trade was with trend, which I prefer, and again, I got in too early and had to sit through 7 ticks of heat and took profit at 8 ticks, then watch the trade go another 120 ticks in my direction.

I then started taking counter trend (CT) trades (not my favourite trades) based on exhaustive selling.  The first one was not very good, but I added to it and still came out in profit.  The second CT trade was a much better signal, but as always, I was too early and sat through 18 ticks of heat.  However, I added more contracts when I saw confirmation of exhaustion and was able to take 25 ticks, but should have held on as price moved up over 90 ticks as I am writing.

So I am still entering too early and sitting through too much heat, rather than waiting for the better entries. I need to work very hard on this.

Here is today's summary and also Monday's.


Tuesday 14 February 2012

Second Post

This is the second day on my (hopefully) successful trading journey. I was unable to trade at the open of the NYMEX and COMEX and opened my charts at 16:00 (GMT). I need to get myself better organised.

I missed two good opportunities by being late, but the 3 trades that I took were very good entries, but again, I took profit too early. All 3 trades could have achieved the 100 ticks mark.

My entries are getting better and I only had to sit through 9 ticks of heat at the worst. The third trade was virtually perfect and I only took 2 ticks of heat. However, my trade management needs to improve if I am to succeed in this business.

Here is today's summary. Tomorrow, I will write about the method I use when analysing the chart before taking a trade.