I only took one trade today as I was watching the Olympics. Finally, GB won gold today. In fact we have two. Bradley Wiggins has been phenomenal and he has again done the business.
I did however, have a trade from last night, long at a demand level and closed it earlier today for a nice profit on 3 lots.
My trade today was on YM. It was a scalp short at a supply zone for 30 ticks. Here is the video of the trade.
http://www.screencast.com/t/cOThRBL2e
Wednesday 1 August 2012
Tuesday 31 July 2012
Unusual activity on ES at today's close
I noticed that the volume of the last two 1 minute bars on the ES were abnormally large. They were around twice the normal volume at this time of day. So something is occurring. Also the RPM histogram on the 50K volume chart were also extremely large, telling me that there was an unusual large amount of speed involved. It seems that the SM are setting up for a large move over the next couple of day's, which could last well into next couple of weeks.
This activity occurred at a demand level from the 25K tick and 50K volume charts. This would normally tell me that a large amount of buying has occurred. However, this could actually be the first sign of a large sell off, as the SM knows there is a lot of demand at this level and this is where they can get a lot of orders filled without moving the market against their selling.
I am expecting the recent rally to continue tomorrow and into Thursday. But as it is NFP on Friday, then I would expect the next large sell off to take place, possibly into good NFP figures.
Over the coming 3 day's we have a lot of very important economic and news announcements from both Europe and the USA, including the FOMC tomorrow. So, I believe that the SM are now getting ready to move the market one way or another and that this is the first sign of their intention.
I do not know which way the market will be going, but I will stick my neck out and say that we should expect a large sell off on Friday.
If you read about my earlier trades, then you would know I was only taking shorts as price was in a downtrend today. I had already finished trading when the best move of the day occurred. Price had moved up to an intraday level and fell over 150 ticks into the close. There was another good breakout trade to be had from it. I never used to like taking breakout trades, but with the RPM and VPI indicators, I can now see where the best breakout trades occur giving me a very high probability and low risk trade. I have attached the 10 range CL to show the B/O trade.


Today's trades
I took 2 CL trades today, both shorts and both winners. The first was a breakout with trend. Price was moving relatively fast after the 15:00 news event and had been in a down trend most of the day. So when it stalled and painted 2 HVC bars on the 500 tick chart I looked for a breakout. The trade was good but I took 6 ticks of heat. I had a 11 tick SL and profit was taken at 23 ticks. I was trying to move my profit target down, but it triggered before I could do so and missed out on another 40 ticks.
The second trade was after a 2 stage pullback and when I saw a HVC followed by a RPM down bar, I entered another short and was aiming for 50 ticks, but it would need to break the recent low. Unfortunately it had problems breaking the low after we had a HVC bar. Once I saw that price was stalling I took profit for only 10 ticks. Good thing too as I would have been stopped out.
Here is the video of the second trade and a screenshot of my entries and exits.
http://www.screencast.com/t/gnmtythjmwuO

Saturday 28 July 2012
Today's trades
I did not take any trades on Friday as I did not have a feel for the market. Price rallied on ES and YM and I do not like one directional days so it was a good decision for me. Anyways, taking breakout trades is not my forte as I prefer the pullback in a trend. There were many breakout trades today for those who prefer them on both instruments. I have poested a few screenshots of RPM breakouts catching the momentum trades. I am seriously looking to start taking breakout trades in the future. I need to lose my OTA head to do so though.
Here are a couple of videos with my trade ideas on oil. I missed a good pull back to a supply zone which could have given around 60 ticks.
http://www.screencast.com/t/Rxcmro2c
http://www.screencast.com/t/hNqI2N6TME


Here are a couple of videos with my trade ideas on oil. I missed a good pull back to a supply zone which could have given around 60 ticks.
http://www.screencast.com/t/Rxcmro2c
http://www.screencast.com/t/hNqI2N6TME


Thursday 26 July 2012
Today's Trades
I seem to have been away from this journal for a while. I am still frustrated with losing my trading account through no fault of my own, to a self confessed fraudster - Russell Wassendorf snr at PFG Best.
So until I get another live account set up, I am trading on Sim on my Optimus demo account.
Anyway, I felt good to be back on the horse again today and took 3 trades on GC, CL and ES. I have videod them and here are the links on screencast. Please leave comments if you like these trades.
http://www.screencast.com/t/9uAXGZBbKGR
http://www.screencast.com/t/0hdOMRuoP
http://www.screencast.com/t/rbNkaRbA
http://www.screencast.com/t/BJfglTE4F
Wednesday 18 July 2012
Today's Trades
I took a total of 5 trades on sim today. The first 2 were on CL, both were stopped out. I was shorting in a rising market. I fared better on GC, 2 trades, 2 wins, but I should have held on longer than I did and would have been a large amount up. I was reading GC very well today. The last trade was on YM, and it was a counter trend, but at a good intraday supply zone. I was able to make 2 videos to show how it turned out.
Here are the links for the YM trade
http://www.screencast.com/t/MYEuy1okq
http://www.screencast.com/t/yRUaCApgY7Bw
Here are the links for the YM trade
http://www.screencast.com/t/MYEuy1okq
http://www.screencast.com/t/yRUaCApgY7Bw
Sunday 15 July 2012
Trading the YM/Dow Jones
Readers of this journal will know that my trading account was wiped out by the collpase of PFG Best last week and I am now going to trade on my spread betting account with IG Index, which is covered by the the FSA in the UK. So what happened with PFG should not occur with IG Index.
The spread on CL is 4 ticks, so I was looking for an instrument with a smaller spread which is also a good mover and satisfy my requirement of 40 ticks per day target. The Euro/USD and the Dow Jones is only 2 ticks. I like the way both of these move, but the DJI seems to move better and as it moves in line with the e-mini SP it fits more with the RPM/VPI indicators. So I will be using the YM as a proxy to see volume and to find intraday S&D zones.
Here are some charts from Friday's YM and ES price action with comments.


Friday 13 July 2012
Today's CL Trade and Gold action
I have only taken one CL trade today, again it was counter trend, but I saw selling coming in with HVC bars on the 5 min chart, so I took a quick breakout trade. I held it to a demand zone for 47 ticks. I could have reversed it on my exit for around 100 ticks, but that is always risky.
Here is the link to the Jing recording. http://www.screencast.com/t/YElBcoT0Hv
Gold looks very interesting at the moment. After over a $40 rally from yesterday's low, I am now seeing a lot of HVC bars at the top of the move. Is this the buyers absorbing the sellers and will continue the up move; Or are the sellers slowly distributing and capping the market? We will have to wait to see which way price breaks, and then trade in that direction. We should get a large move either way.
Here is the GC 2K tick chart

Thursday 12 July 2012
PFG Best
I am or was a customer of PFG best. However, this week, they have been shut down by the CFTC/NFA due to large scale fraud committed by individual (s) within the company. I have quite a large amount of money within the company which I am unable to withdraw. I do not know if I will see any of my money again.
I have opened a new demo account with Optimus and may fund a small amount to enable me to trade 2 positions in the future, but I will not allocate all my trading fund into the account as I did with PFG. I feel very depressed at the moment and if this is what we should expect within this industry, I may stop altogether.
This is a very tough lesson to learn.
However, I remain hopeful that I will see some of my money returned.
I also have a spread betting account in the UK with I G Index which is quite a large firm and they are covered by the FSA. So I am insured if this should happen over here. I will probably trade CL on the spread bet platform, while using a futures data feed for my analytics. This would mean paying $50 P/Month to a data provider like Kinetic. The downside is that I would be paying 4 tick spread, but if I am going for 40 ticks each day, then this is a reasonable charge and there is no commission to pay.
I hope things work out for me and that I can continue trading as I have found something that I am good at and do not have the hassle of working for someone else.
I hope things work out for all other PFG clients caught up in this mess.
I really think the CFTC and the NFA really need to think long and hard and bring in legislations to protect clients of Futures brokers and also to maintain credibility and confidence in this industry.
Wednesday 11 July 2012
Gold, TF and the Head and Shoulder pattern
Yesterday, there was a large sell off on gold. I looked on the 60 min chart and it appeared to be a selling climax, but as there was no large up move today and that yesterday's volume seemed too low for a selling climax, then we may have a 'Gotcha' daily bar which makes GC very weak. If so, then expect the recent lows around 1550 to be re-visited and maybe even 1530.
The Head and shoulders pattern is one of the most talked about patterns in trading, but the way it is taught makes it a very high risk trade. However, using the RPM and VPI indicator, we can reduce the risk and get in at the right shoulder. The right shoulder is the retracement after a new trend/directional move has started and that is where we should look to enter rather than the break of the right collar. This gives us a better R:R and we have a smaller SL.
I have used today's TF 300 tick chart to illustrate how we can use HVC to identify the left shoulder or use the RPM to enter on the right shoulder if we did not get a HVC on the left shoulder.


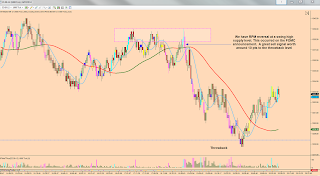
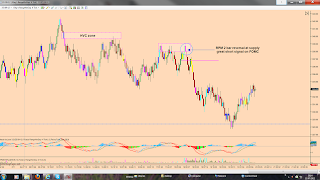
FOMC Announcement
Today was the FOMC, so I prepared myself to trade CL and was able to make a 5 minute video on Jing which I have posted to the Screencast sharing site. As usual my first entry was too early but my second entry was very nearly perfect. I also added 2 further positions as the trade went in my favour, but it was on the breakout rather than pull back method. Here is the link.
http://www.screencast.com/t/ZeO3GgP4458u
I could not trade ES on the FOMC announcement as I was trading CL, but the RPM gave an extremely good short signal on the 4 range and 1K tick charts, that was worth up to 10 points. See the attached screenshots.
On Monday I wrote that I was expecting more down move on ES and to short the larger rallies. Yesterday, price rallied strongly from early morning into the open and then fell about 25 points from there. The fall occurred just below a Throwback level and the 10K tick chart gave a great RPM 2 bar reversal short signal at the time. See the 3rd screenshot.
Apart from the FOMC trade, I took another 4 trades on CL, all shorts, in a rising market. The first was another 2 positions, again, I was early on the first but the 2nd entry was better. I scaled 1 position just above a demand level for 29 ticks, and held on to the second for another demand level below. Unfortunately price turned at the first demand level and I was stopped out on the second position for a loss of 3 ticks as I did not trail it down. So, the 2nd position which was 60 ticks in profit at one stage, turned into a 3 tick loss. 'Truly Amazing' is all I can say.
The next two shorts I tried was trying to call the top of the up move and both were losers, 8 and 9 ticks respectively. The second one got stopped to the tick and then fell, around 150 ticks from there. I did manage to get in on another short for 22 ticks, but should have held it to the demand zone around 15 ticks lower. And then I got in the FOMC short where I rode it down to another demand level for a good exit. Pity I did not reverse there as price has since rallied over 100 ticks from there. See the last screenshot with my trades marked on it.


Sunday 8 July 2012
NFP Price action
The NFP news event on Friday drove price down on GC, CL and ES. However, the ES rallied 10 points over the last 90 minutes of trading.
On the Thursday, I had seen very aggressive selling early on for all 3 instruments and this should have given me an indication where price was headed over the next couple of day. I do not trade on NFP day, so I was just watching.
I missed a good short on Thursday on ES and also CL after seeing the aggressive selling. CL has since fallen 400 ticks right to where I expected it to.
I will be looking for the better supply levels to short on all 3 instrument on Monday. Here are some charts over the last 2 days.


Monday 25 June 2012
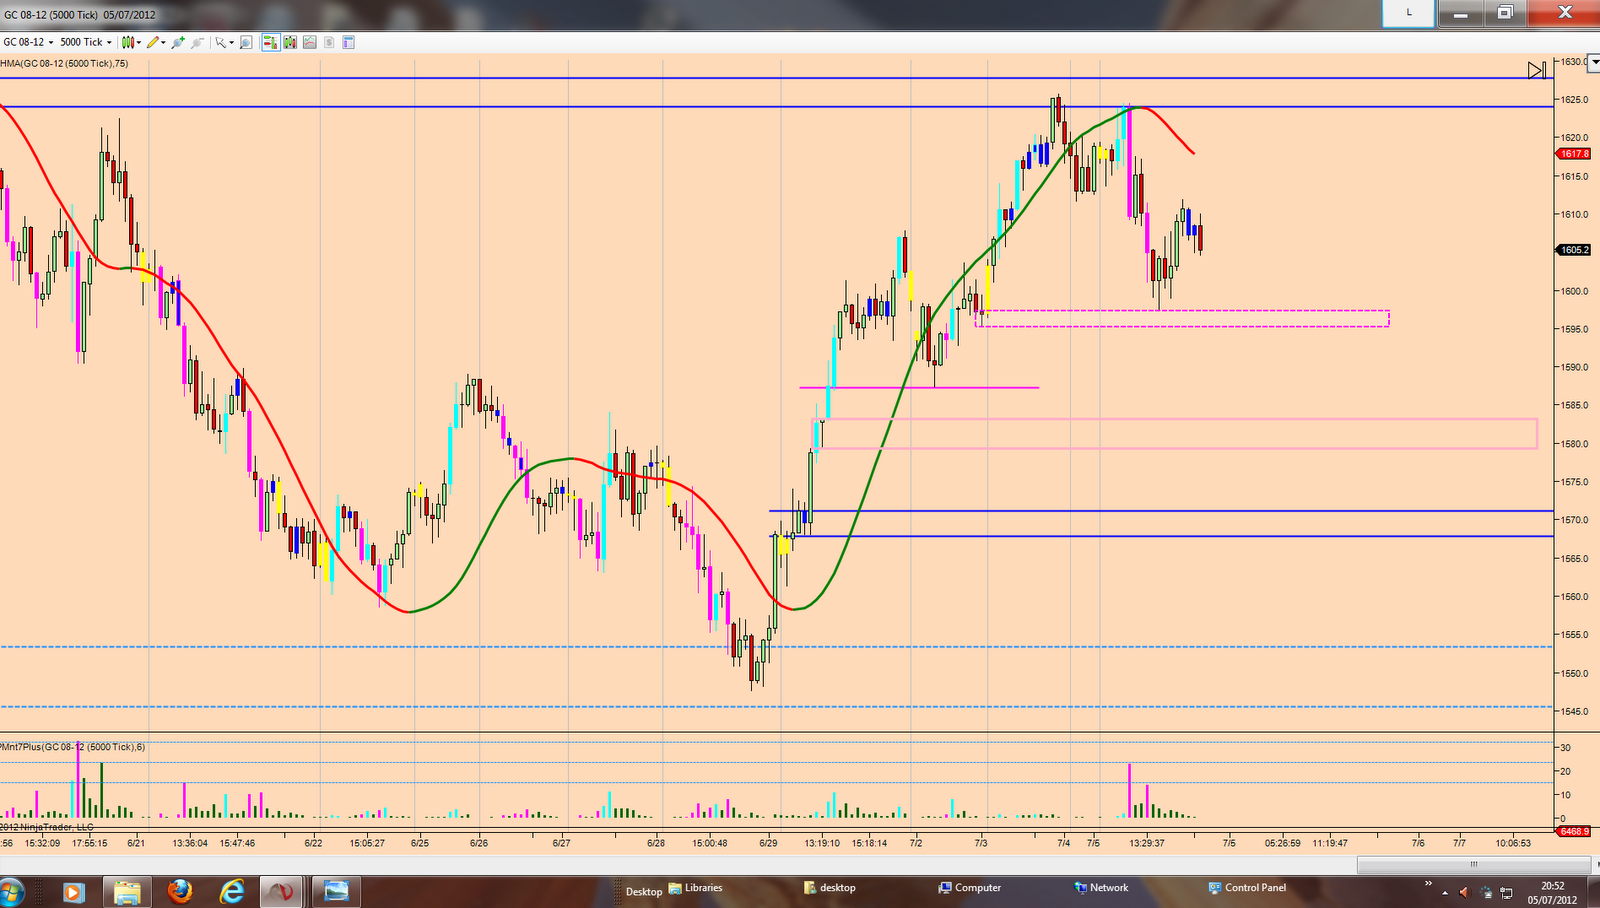
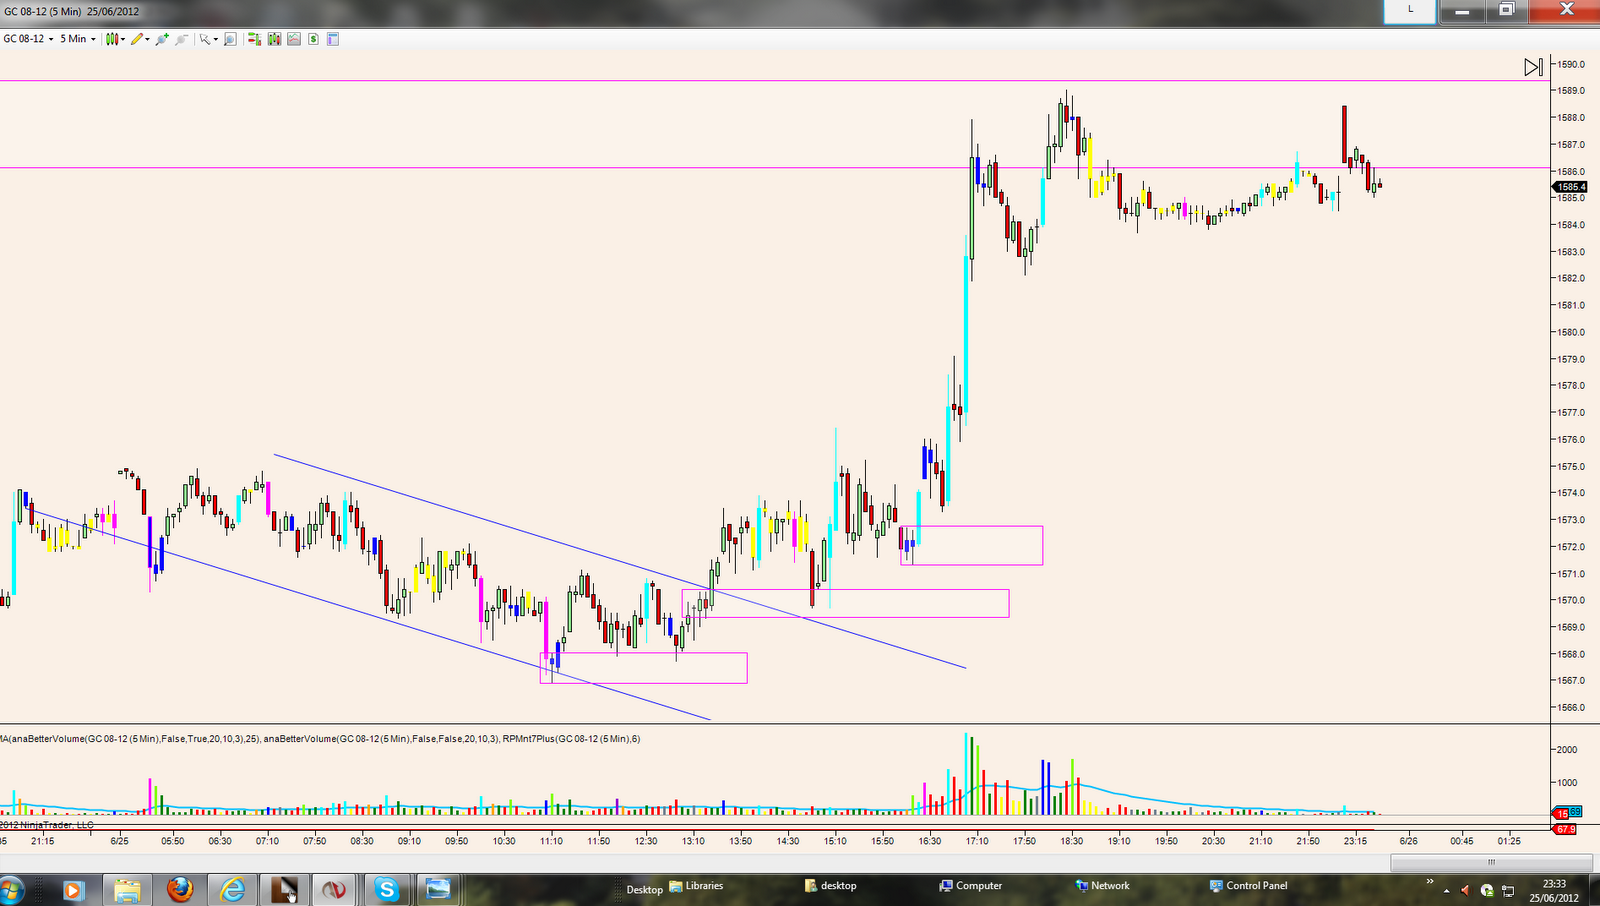
Today's Gold analysis
On my last gold analysis, I said I saw buying coming into this market and expected the up move to continue and to buy the dips today. Well, this was the case. After a corrective down move from Friday's high, we formed a demand zone on the smaller charts and rallied $22 up to the first supply zone near 1590 that I had identified in my last post.
The rally was on low volume as I expected, but I still think price will continue up to around the 1600 - 1605 level. After that, I will have to assess if this is just another stop hunt by the MM, taking out the SLs of the short traders before crashing further down, or that genuine demand is coming in.
Here are the charts


Today's Trade
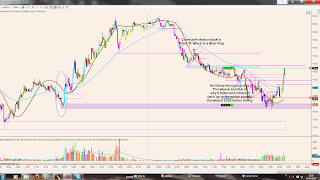
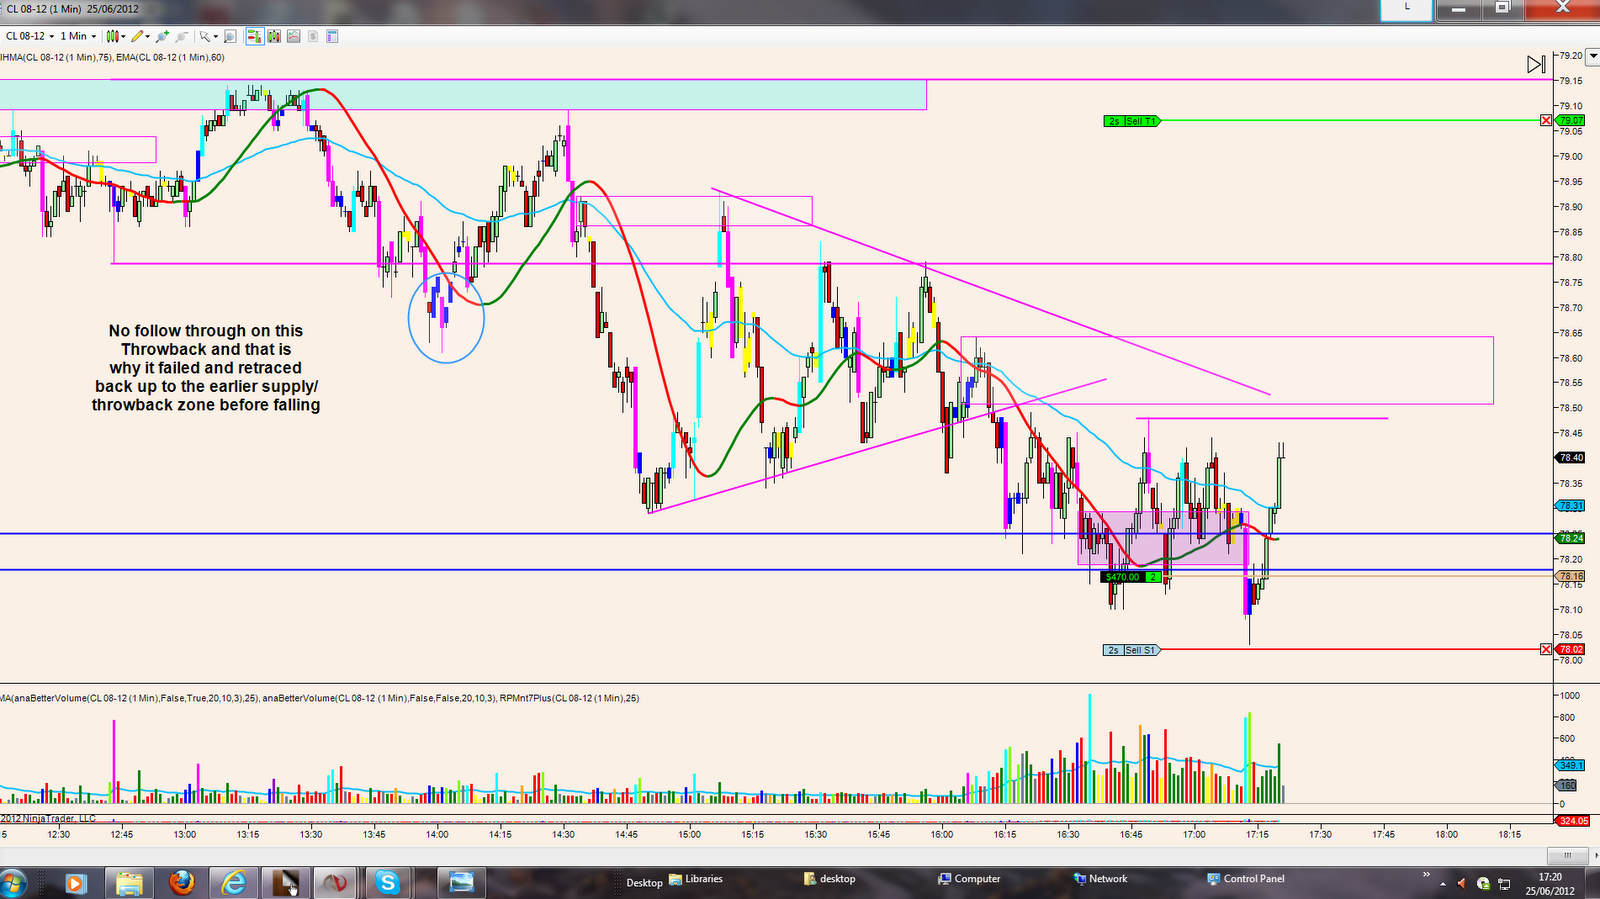
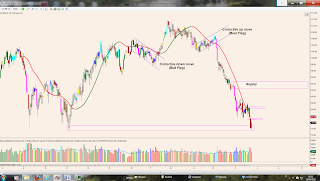
Today I was nearly bored to tears waiting for a long set up when price retraced back to a really good demand level on the 1K tick chart which was formed on Friday afternoon, where we had a very impulsive move up with lots of RPM bars leading to a 200 tick rally into Friday's close.
I waited for over 4 hours, but in the end my patience paid off. I scaled into the trade, and as usual my first entry was too early, but my second entry was almost perfect. I was nearly stopped out as price missed my SL by 1 tick. I need to wait for confirmation of a trend change and then enter with a RPM signal to avoid taking unnecessary stop outs. I am working on this aspect and will get better with more experience.
My first scale out was for 46 ticks, but I really should have done better with it and my second scale out was for 100 ticks just below a throwback supply zone, where price retraced, so it was a good exit. Price continued up later on, but I was very happy with the trade.
I took screenshots before, during and after the trade to show how I identified, entered and exited.
I did not look at another instrument whilst waiting for the set up to arrive and missed some nice trades on them, especially Gold, where I was looking to buy the dip today (see my last gold analysis). But I am pleased that I was patient and I will continue my focus on CL this week. The good thing was that I was never tempted to take a counter trend scalp.
Here are the charts


Sunday 24 June 2012
S&D levels for Trading CL tomorrow
I have attached some charts identifying S&D zones on CL that I will be looking to trade from tomorrow and in the coming days. You will notice the different chart types and chart sizes.
I try and trade too many pairs and end up missing too many good moves as you will have read in some of my previous posts. So this week, I am going to only focus on CL, and, only look to take trades at the better zones, i.e ones where there has been strong moves away from a possible S&D zone with RPM bars. This should stop my preponderance of taking stupid counter trend scalps
However, I will continue to carry out my end of day hindsight analysis on the other instruments to continue my education of how price moves on each of them.
As an intraday trader, I concentrate on levels formed on the day or from the previous day using the 1K and 500 tick and volume charts and also the 5 min chart. However, recently, I have been looking further afield using a bigger Volume and Tick chart (5K) to get S&D zones. From now on, I will also use the 4hr and 1 hr charts and the daily charts to get a bigger picture overview.
By looking on the smaller time based charts and smaller tick and volume charts (500 and 1K for both), I have 'tunnel vision' and miss out on seeing important price action that is available on the 4hr and 1 hr charts, especially corrective moves back into a good S&D zone. .
By carrying out this analysis today, it became very obvious that the larger timebased charts are better than the small tick and volume charts for seeing corrective moves back into S&D zones.
Although, I trade counter trend, when the opportunity offers themselves, I prefer to trade in the direction of the impulsive moves and against the corrective moves (except when I take stupid CT scalps) as there is a higher probability of the trade working and also have a larger profit potential.
So this is the way forward for me.
Nb, using the daily chart, I could see why we had a bounce up of 280 ticks on Friday, as it was the swing low from last October.
So here are the charts with zones I will be looking at tomorrow.


Subscribe to:
Posts (Atom)