Thursday 31 May 2012

Today's Oil action

I focused mostly on Oil today and missed the good trend re-engagement trades on TF and ES.  See below for explanation of the trades on those instruments. I lost my first 3 CL trades, by trying to fight the down trend.  I do not understand, why I always seem to be fighting the trend, when trend re-engagement entries are easier and more profitable.

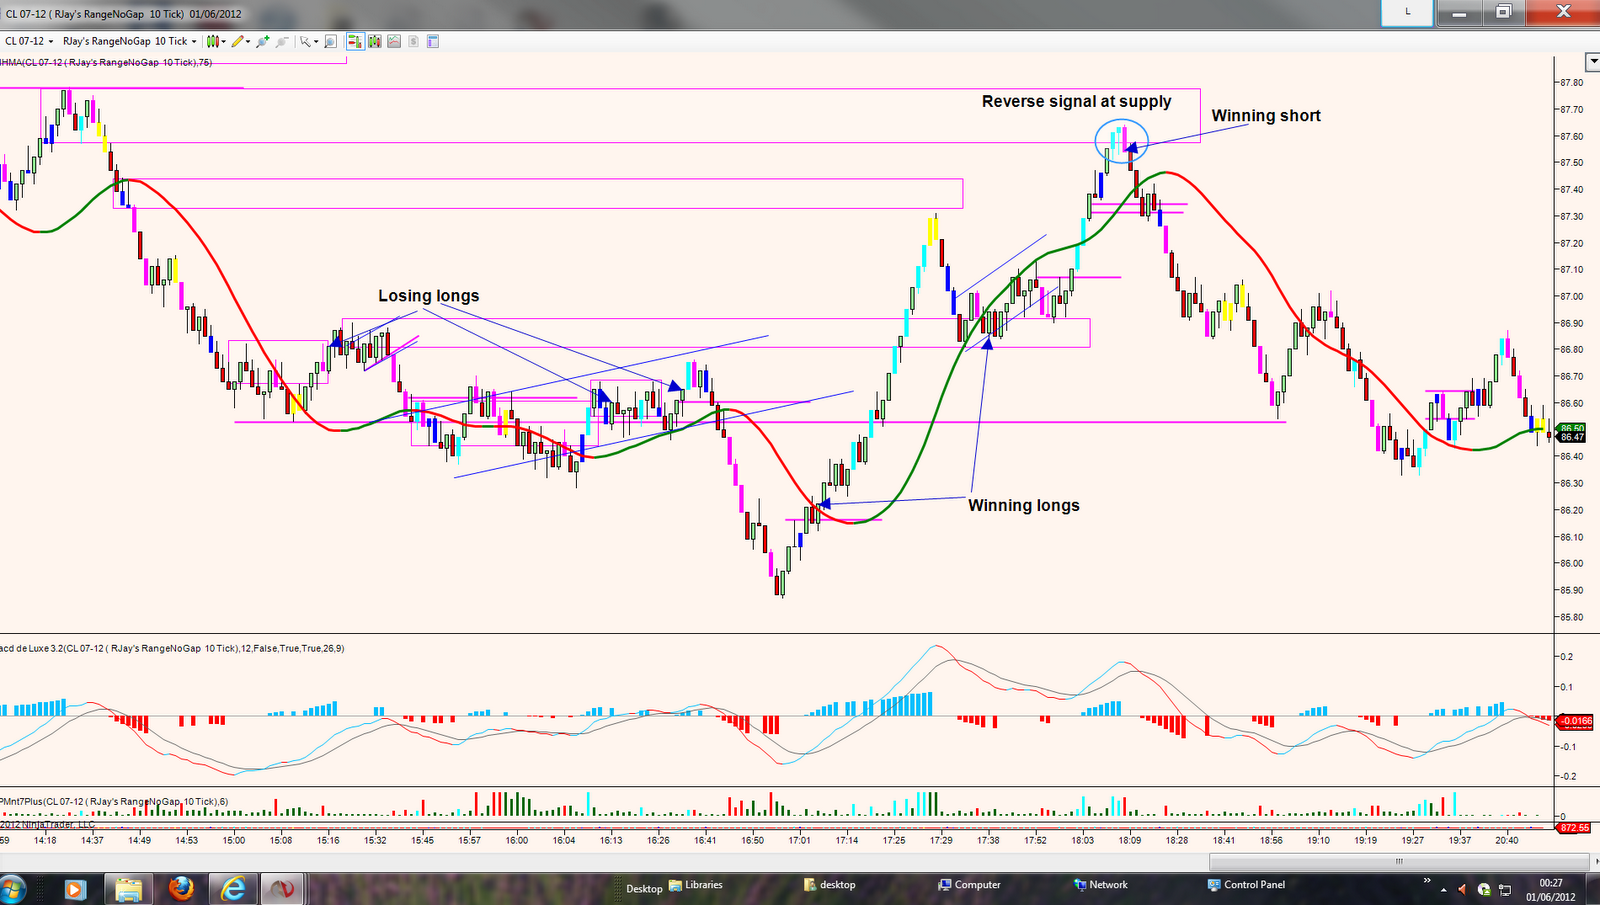
Anyway, after the first 3 losers, I eventually got into a winning long trade and held for 52 ticks, but should have held it to a supply zone for over 100 ticks.  I then took a trend re-engagement long at a throwback, but only held for 20 ticks, missing out on another possible 50 ticks. I then took a supply trade with a RPM reverse signal, and again baled out too quickly for another 20 ticks, only to see price moved further down for what should have been another 100 tick trade.

So from today, I need to learn not to keep fighting the trend and wait for a good reverse entry signal, either with the MACD or RPM and look for more trend re-engagement trades.

I still ended up on the day, on CL, despite not trading it very well

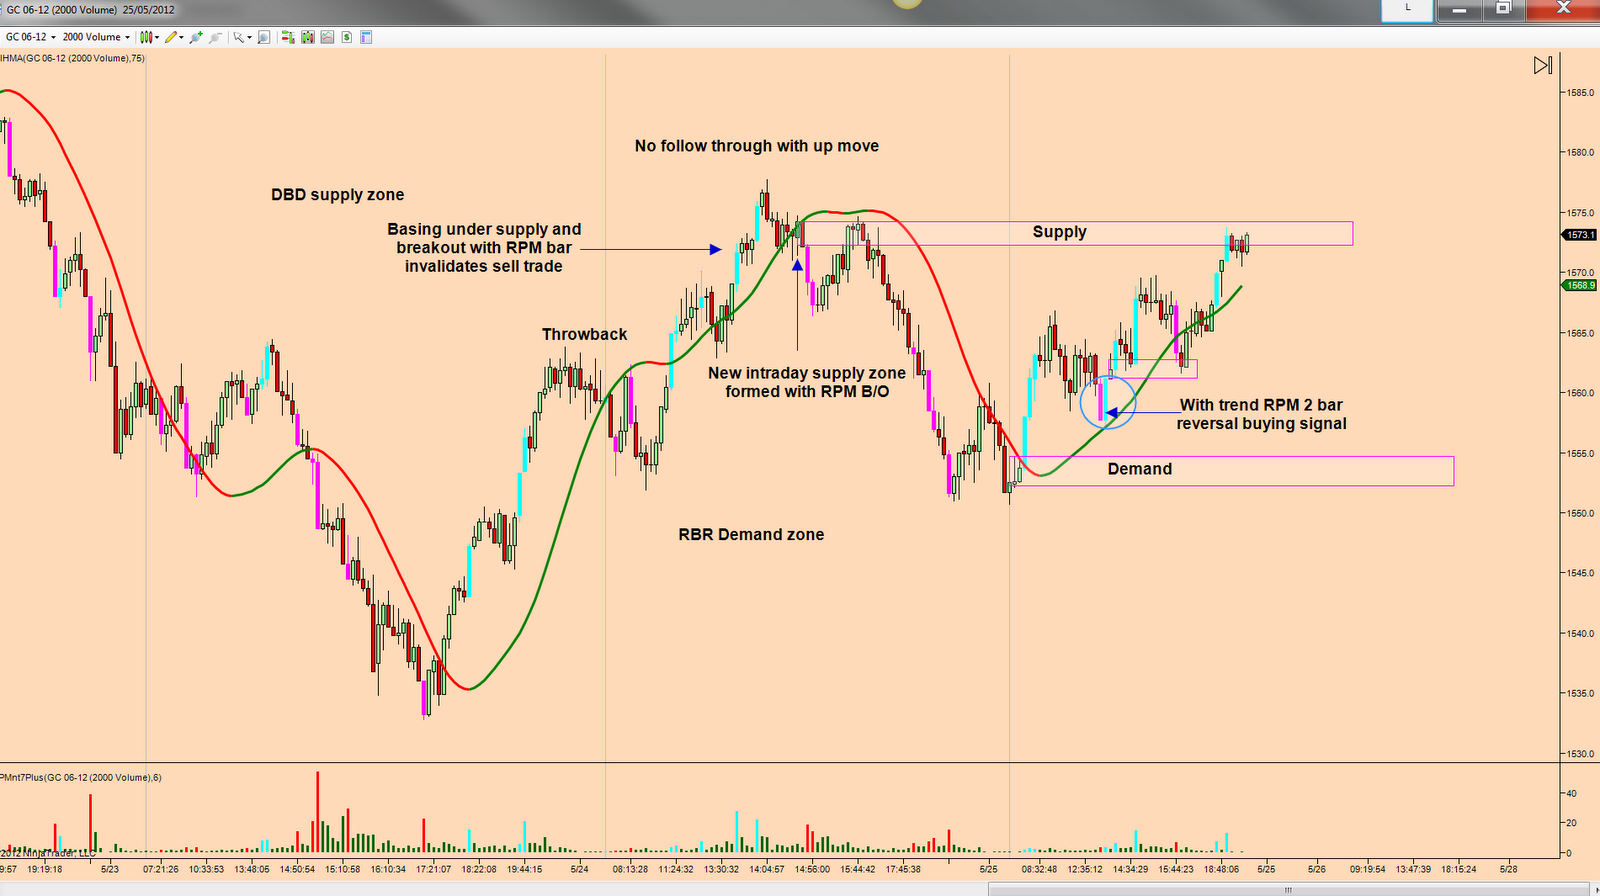
Here are the CL charts with all my lines and boxes to show how my charts look while I am analysing as price unfold during the day. I have not put the trades on the charts as they would make the charts too messy, but pointed them out on the 10 range bar chart.


Today's Gold action

Gold never fails to amaze.  Today we had quite a lot of large swings, the biggest being $21.  Again, these swings end on climax volume on the 5 min chart.  The biggest swing was over very quickly, which seems to me that stops were being taken out on both the longs and shorts.  I had just opened my charts when I saw the big swing unfolding.  Price was going up very fast, then it reversed just as quickly. I expect a lot of traders were trapped on the wrong side today.  There were some good RPM signals today, but it would have been very scary trading GC today.  Good thing I did not trade it.

Here are the charts


Today's ES trade

The ES trade was a replica of the TF trade.  I took 5 points, after another premature entry.  This time, I only had 1 contract. Again, I missed 2 very good RPM trend re-engament.  I am able to watch ES and TF at the same time as they both move the same way, so it is like making two trades with 1 analysis.

Here are the charts with comments


Today's TF trade

I have been making trades on TF recently and today, I will show the trades I took on TF and ES.
This first post for today is the TF trade.

Today from the open price moved down rapidly, and unusual for TF, we had high volume for 9 bars after the open.  Normally we only have the first 2 or 3 bars on high volume and then it decreases.  So seeing this price action, I was expecting a big trend day or a large reverse.  Fortunately for me, we had the latter.  I hate it when we just have price going in one direction all day, as I never seem to get a trend trade on and end up fighting the trend.

Once I saw price retracing back down in a corrective manner on decreasing volume, after a an impulsive bounce up from the low, it looked good for a long.

As usual, my first entry was early, but I scaled in with a second position with a better price. I held the
trade until the last swing high for 33 and 23 ticks, giving a total of 53 ticks for TF today.  I then
started looking for trades on CL, so I missed all the great RPM trend re-engagement signals on TF.  I really should have stayed with TF as I was expecting a large reverse after the earlier price action.  I need to concentrate on just one instrument, but I love trading CL and GC and that is the reason I keep a watch on those two.

Here are the 5 min, 300 tick, and 6 range bar charts with comments.


Wednesday 30 May 2012

Volume

Carrying on from yesterday's post, I am continuing the theme of using large volume to help with determining swing point turns.  Today around 12:00 PM BST (07:00 EST) we had some news out of Europe concerning Greece and price rallied in all markets (Indices, Gold, Oil) on very large volume.  This was used by the market makers to take out stops from short traders and encourage breakout longs.  Price then reversed very fast for all 3 markets and fell all day, with the exception of Gold which rallied nearly $40 after falling $25.

In today's example, we see that large volume is important at swing points, but that not all large volume will reverse a move as seen with oil and shows how weak that market is.

I have attached the 5 minute and 10 range charts for both Oil and Gold to show how volume affected each market differently and how to use the 10 Range and MACD to get into a reverse trade after seeing the large volume and not getting into a bad trade by anticipating a reverse after climax volume.

I have put vertical red lines on the 10 Range Oil chart to show where the large climax volume bars occurred so you can see that we did not have an impulsive counter move after the last 3 climax volume bars, so they did not offer a reverse trade unlike the first one.

Nb, I traded TF today.  Had one trade with 2 positions, counter trend long after large volume on 5 min.  Scaled in another position after a breakout.  Scaled out of my first 2 positions at a supply zone for 37 ticks and then scaled out on my scaled in position for only 11 ticks after I saw supply returning.  I should have reversed the trade when I realised that the sellers were in total control.  But overall 85 ticks aggregate for all 3 positions. Not too bad.


Tuesday 29 May 2012

Gold price action

Once again, gold is the big mover in today's charts.  We had a massive $37 drop from mid afternoon until the close of the COMEX.  I took a very good short entry and only held for 20 ticks and watched price fall 350 ticks from my exit.  The reason I took profits early was that I had taken 2 earlier losses and did not want to have 3 consecutive losses.  Drat.  Could have been trade of the year.

Anyway, as anyone following me, will know, that I use volume as my main supply or demand identifier, as most major intraday swings ends with climax volume (as identified by the better volume indicator on the time based charts).

Today, I will show why volume is important and even though the majority of major swings ends with climax volume, most climax volume bars do not lead to reversal of swings.  Quite a lot of them are trend continuation.

When I first started experimenting with volume and churn bars, I thought we would get a reversal everytime we got this combination, but I was wrong and paid very heavily for that error.  Nowadays, I wait to see a trend change and use the range bar chart to get a better entry.  The HMA and MACD stop me getting in to a trend change trade too quickly as I used to do and help me time my entries much better.

See today's chart from both GC and CL.


Friday 25 May 2012

ES, TF and CL action

The large down move on ES started at the London opening where we had a very large price bar on very high volume for the time of day.

After the NY opening we had a long period of consolidation in a small range before the ES fell more later in the afternoon.

The TF was also stuck in the small range and I was able to take 6 points on Sim playing 'Ping Pong' between the top and bottom of the zone.

CL was stuck in a relatively small range today making trading difficult.  The large up move prior to the London opening was stopped with a very large up bar on climax churn volume.


Todays Gold Analysis

I took only sim trades today and was playing the ping pong trades on TF between two HVC zones for 6 points.

However, today's full analysis is again gold as it is still the best for intraday swings at the moment. Gold went up $20 in choppy fashions, but each swing was worth trading.

Again, we see on the 5 min chart how the initial up move is started by climax volume bar. The move started before the London opening, so it shows how the Market Manipulators move the market at any time of day.

As usual, each swing is ended by climax volume bars and shows how important the use of volume is to see supply and demand at the hard right edge of the chart.


Thursday 24 May 2012

RPM and VPI signals

I thought I would continue the theme from yesterday to show how RPM 'with trend' signals can lead to a stress free trade.  I have also included the signals from the Volume Patterns Indicator to show how these 2 indicators work together.  I personally believe that these 2 indicators and the Better Volume on the timebased charts helps me read the chart better in real time.  No lagging indicators required, unless you count the HMA.  The explanations are on the charts for CL, ES and TF. There is a full hindsight analysis on gold below.

It is amazing that people pay hundred of dollars for lagging indicators and I have these free of charge from BMT.


Today's gold action

I am still on the sick list so no trading for me again today.

Todays analysis is focused on Gold as it is really having 2 great swings each day.  Today the swings were $25.  We had good reasons to get into both swings.  The up move was was a breakout from a 5 min CCH bar on very high volume for 09:00 and the second was a very good supply zone formed about 45 minutes before the down move started. 

There was a supply zone just above, which was formed 2 days earlier, but it was invalidated by HVC basing and RPM breakout just under the supply zone, but a new intraday zone was formed on the large tick and volume charts.  We then had a smaller HVC supply zone formed within the larger zone for a better entry on the small tick chart (400).  See charts for details.


Wednesday 23 May 2012

Todays analysis

I have been unwell over the last 3 days, so no trading.  However, I decided to carry out analysis on CL, GC, ES and TF for todays price action. 

When I first came across the RPM indicator, it did not have the paint bar functionality, so I asked one of the programmers over at BMT to add it so I can look at the price bar rather than the histograms below the chart as this was easier for me.  This made me see how good an indicator it was at spotting exhaustion in the retrace to get back into a trend trade on the 10 range chart.  However, using the larger, tick and volume charts, this type of entry shows up extremely well.  And as we are using it to get a trend re-engagement signal, it is much less stressful than trying to pick tops and bottoms.

Today there were many trend re-engagement signals on all 4 instruments.  Price action today was absolutely brilliant where we had 2 massive swings on all instruments apart from CL.  GC had 2 $30 swings.  Here are the charts