If I was trading TF, I would also have taken a long near the low of the day.
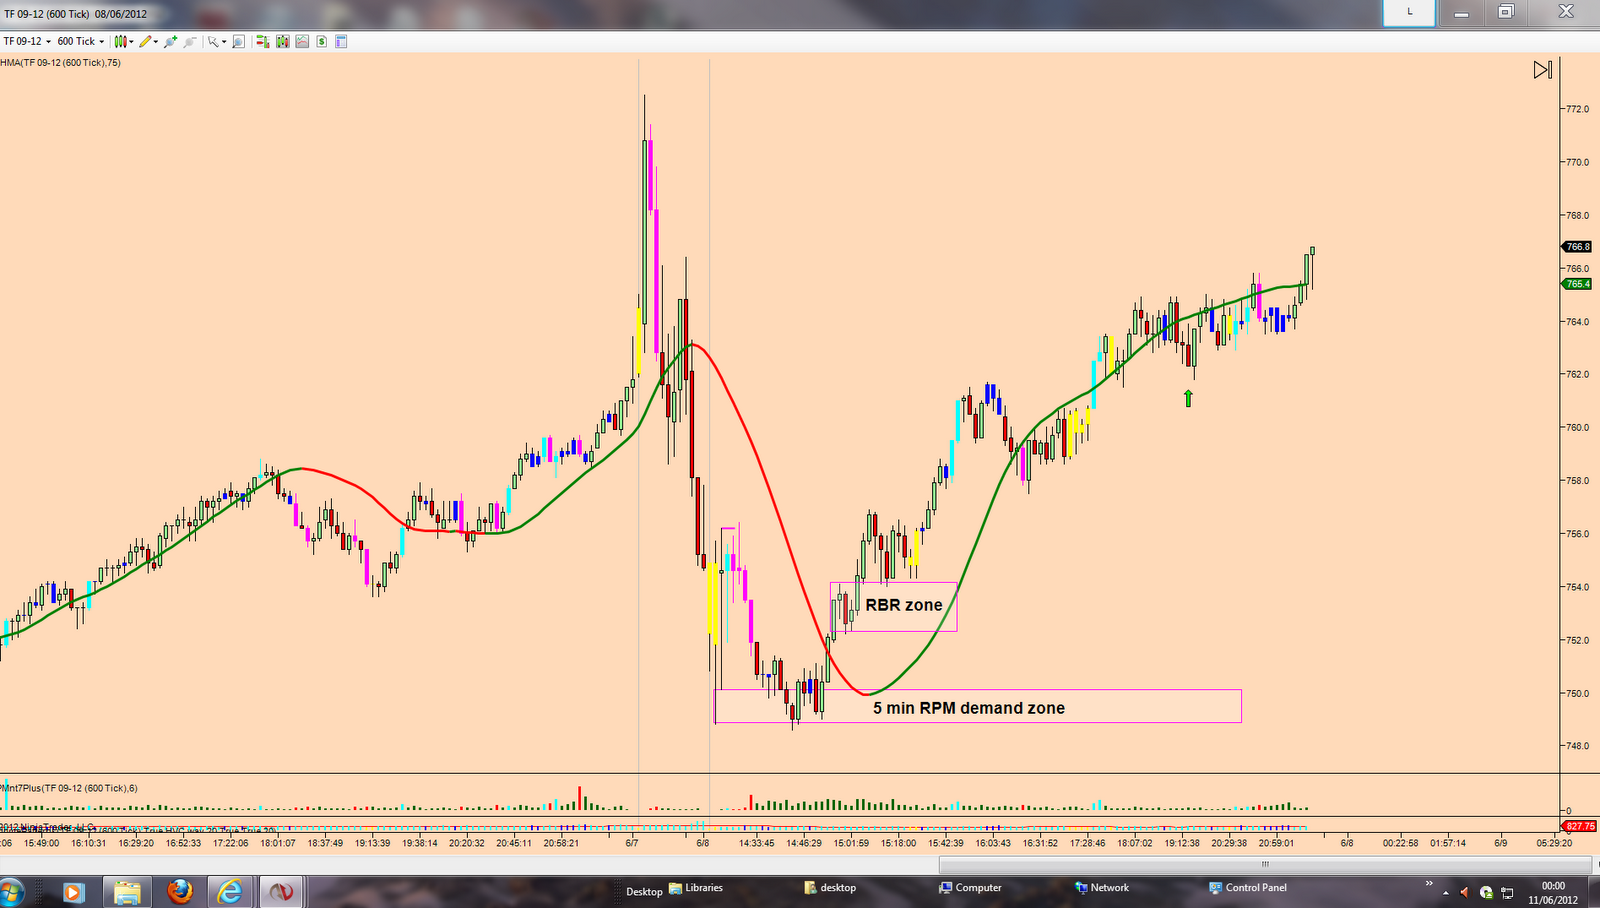
Look on the 5 min chart we see that price bounced up around 09:45 am (BST) and created a RPM demand zone as we had a good follow through. Price then revisited and bounced off about 90 minutes later and reversed at the intrday high back down to the demand zone. We then see a HVC bar piercing the low of the demand zone but closing at the top, giving a bullish out look and eventually we get a RPM bar breaking away from the zone for an entry long.
However, the 600 volume chart gave a better entry when we see a RPM bar breaking out of the zone for a lower entry price.
As this was the second visit to the zone, it was not perfect, but if price was to continue down, we would have seen a RPM bar breaking the low, so using the RPM, we can to tell whether buyers or seller are more aggressive at a zone and use this to determine our trade direction.


No comments:
Post a Comment