I do not trade on NFP day due to the extreme volatility of price, so I just watched the charts today.
Gold was again the star performer, moving up a mind blowing $87, from low to high today, and was once again a safe haven in what was a very bad day for the stock indices and Oil. Although Oil did rally over 100 ticks into the close of trading today.
I did not open my Ninja Trader platform until after 14:00 (BST) so I missed the NFP violence. I saw that Oil was falling like a rock and then looked at gold, which had gone up about $45 at that point. And it just kept going up with hardly a pause.
I had never made notes on NFP day because I rarely opened my charts to make any analysis in the past, but I thought I would look closely at it today. What I saw was very interesting on Gold, although it does not explain the $87 increase in price. Yesterday, I alluded to stops being taken out in both directions for longer term swing traders, and it would appear that today is no different. It would not surprise me if we get a very large down move on Monday and further falls next week. Or this could be the start of the rally back up to the $1900 level, based on Gold being a safe haven. But we know the last time that they said it was, it fell $400 from it's record high. So I am not going to become a gold bull based on today's large rally.
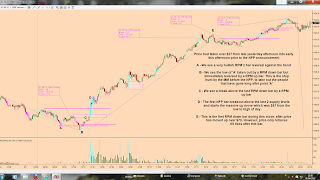
The first chart is the 5 min chart and I have only shown the price action just before the NFP announcement to better show the volume at each major swing point before the NFP. The second chart is the 1000 volume chart with extensive comments, but the most notable one was the stop hunt for traders who had gone long too early.
We see a swing low being broken by a RPM down bar and expectations is that price will continue the move down further, trapping the people that went long earlier. But we immediately see a RPM up bar reversing this, and then a break above the RPM down bar, before breaking above a HVC basing zone (on the 400 tick chart). We can then trade the failure of the RPM down bar and start looking for longs, with the breakout of the HVC basing zone.
The Market Manipulators (MM), seem to do this before any large moves and this is why we see good supply and demand zones broken and then price reverses back into the direction that you thought it would go.
You will notice the two long legged Doji's on high volume at swing lows, giving away the intentions of the Smart Money before the NFP.
Another thing I noticed is that on days like this, trying to get a demand trade in the up move was nigh on impossible and there was only one demand zone that was re-visited, but would have given a $50 profit. I do not like with trend breakout trading (breakout above a swing high in an up trend) but they would have worked today.
I am going to do analysis of recent past NFP days and see if I can learn more, and maybe lose my reticence to trade on them.
Here are the charts.


No comments:
Post a Comment