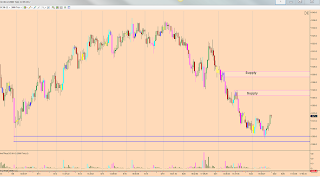
Last week, I believed that price would break above the supply zone and push on to the 1700 level, but the consolidation we had seen for several days, was on low volume and turned out to be distribution rather than absorption as I had originally thought. We then had the massive sell off into Friday morning and price turned at the demand level from the climax selling seen on 8 June. I did identify this level on my last analysis. I also had a buy trade at that level, but did not hold it long enough.
I have not used the daily chart for any of my analysis so far, as the it is corrupted on the Ninja Trader platform, so today, I used the 1440 min chart to see the daily price action. From this I could see that the supply level was still a very strong level and the retrace back to it was on very low volume, so with this, I would have been looking for a fall in price rather than a break of the supply level. So from now on, I will use the 1140 min chart in all my weekly analysis.
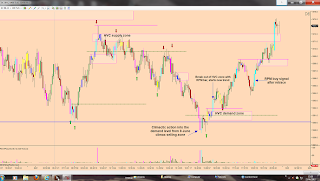
Back to yesterday's price action. We had a large move up from the London open, just above the June 8 demand zone, and then we had a very large climax volume bar on the 5 min chart, but price just went sideways for 4 hours. On the 1K tick chart we had a lot of HVC bars clustering and then price fell back into the earlier demand zone.
We then had another large volume bar at the demand zone and price rallied over $14 after this. So this demand level from the 8 June was important as I had said yesterday. If it is broken, then we should see price go down to the 1530 level.
The HVC clustering looks like buyers were absorbing the supply at that zone, before price fell from the level. So now that this level has been broken, I expect the rally to continue, probably back to the 1590 - 1600 level. If it is on low volume, then I would expect another large fall to the 1530 level.
So for Monday, I am looking to buy the dips.
Here are the charts


No comments:
Post a Comment