Price fell from yesterday's high right down to the 1320 level. I have been watching this level for a while as it is a good throwback on the daily chart. See my post from last week about low volume on the ES for spotting top reversal, I had identified that level -
http://theshortcableguy.blogspot.co.uk/2012/05/why-low-volume-is-as-important-as-high.html
Anyway, as usually occurs when a large move is reversed, we have large volume and we got that on the 15 min chart. Price rose and created a couple of demand levels on the 10 K vol chart. The first sign of weakness came at a supply level from yesterday and there was another level just above this one where we got the reversal.
I like using volume charts rather than tick charts for spotting the extreme RPM bars, especially for exhaustion of a long directional move. However today, there was one about 16:05pm (BST) where it broke out of a basing area and broke through a demand level with follow through. This was not too far from where price reversed from the HOD. So this was not exhaustion. When price retraced back to the basing area, it fell again, this time with a very bearish looking RPM bar with a long supply tail and never returned. Falling back to the day's low.
So it is important to look on the volume charts whenever there is a large impulsive move to see if we have extreme RPM as these can highlight the better S&D zones as well as exhaustion.
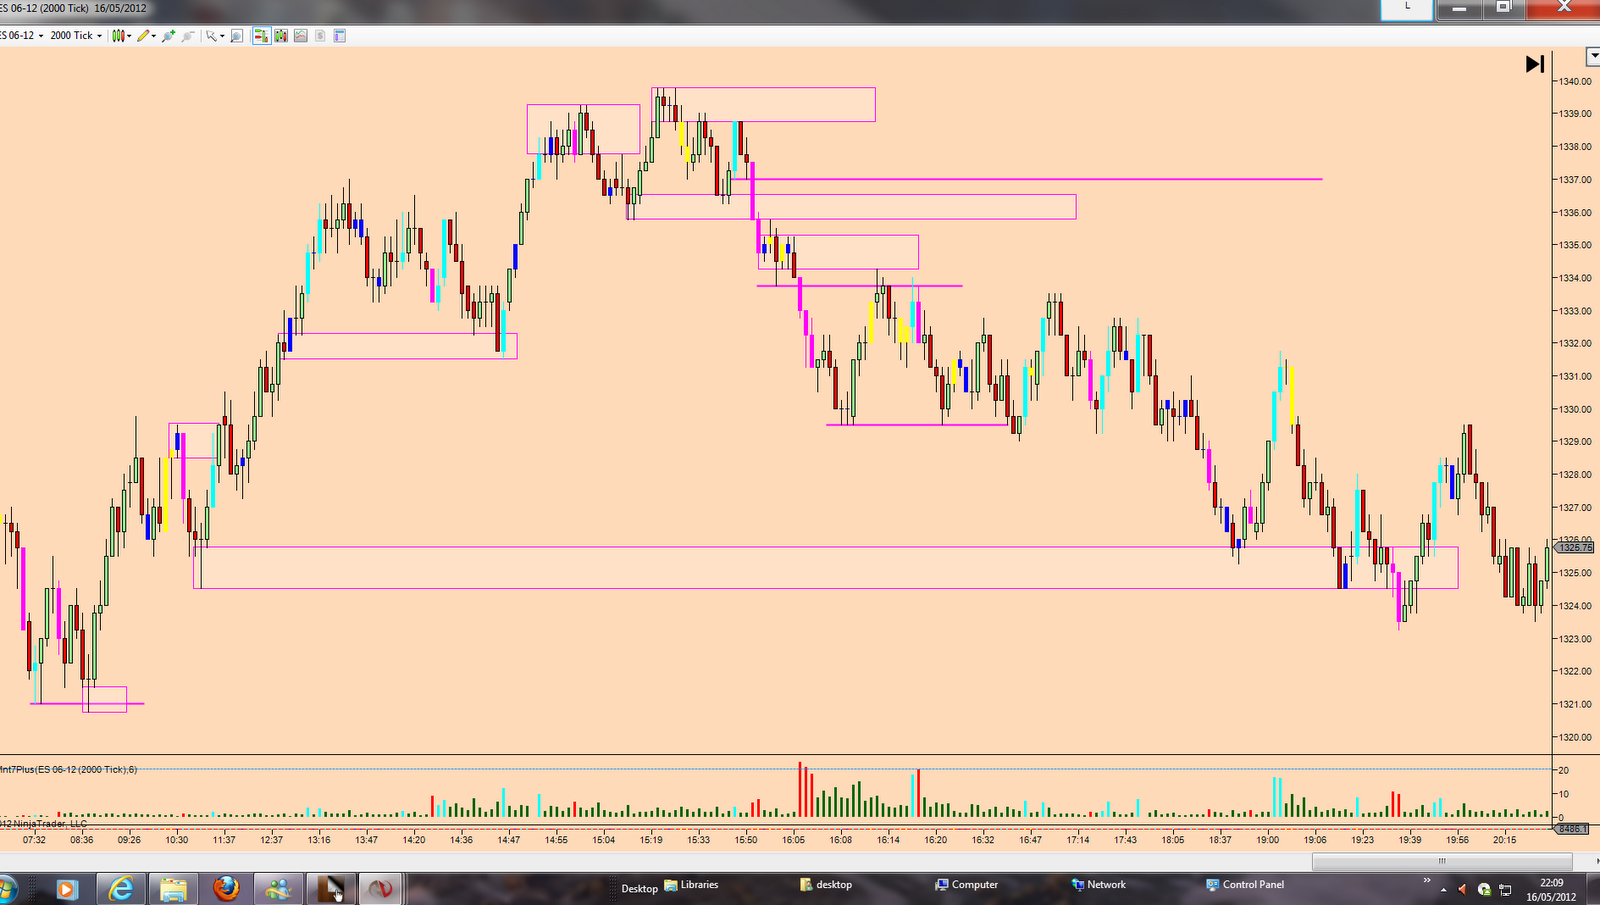
Here are today's charts

No comments:
Post a Comment