In today's example, we see that large volume is important at swing points, but that not all large volume will reverse a move as seen with oil and shows how weak that market is.
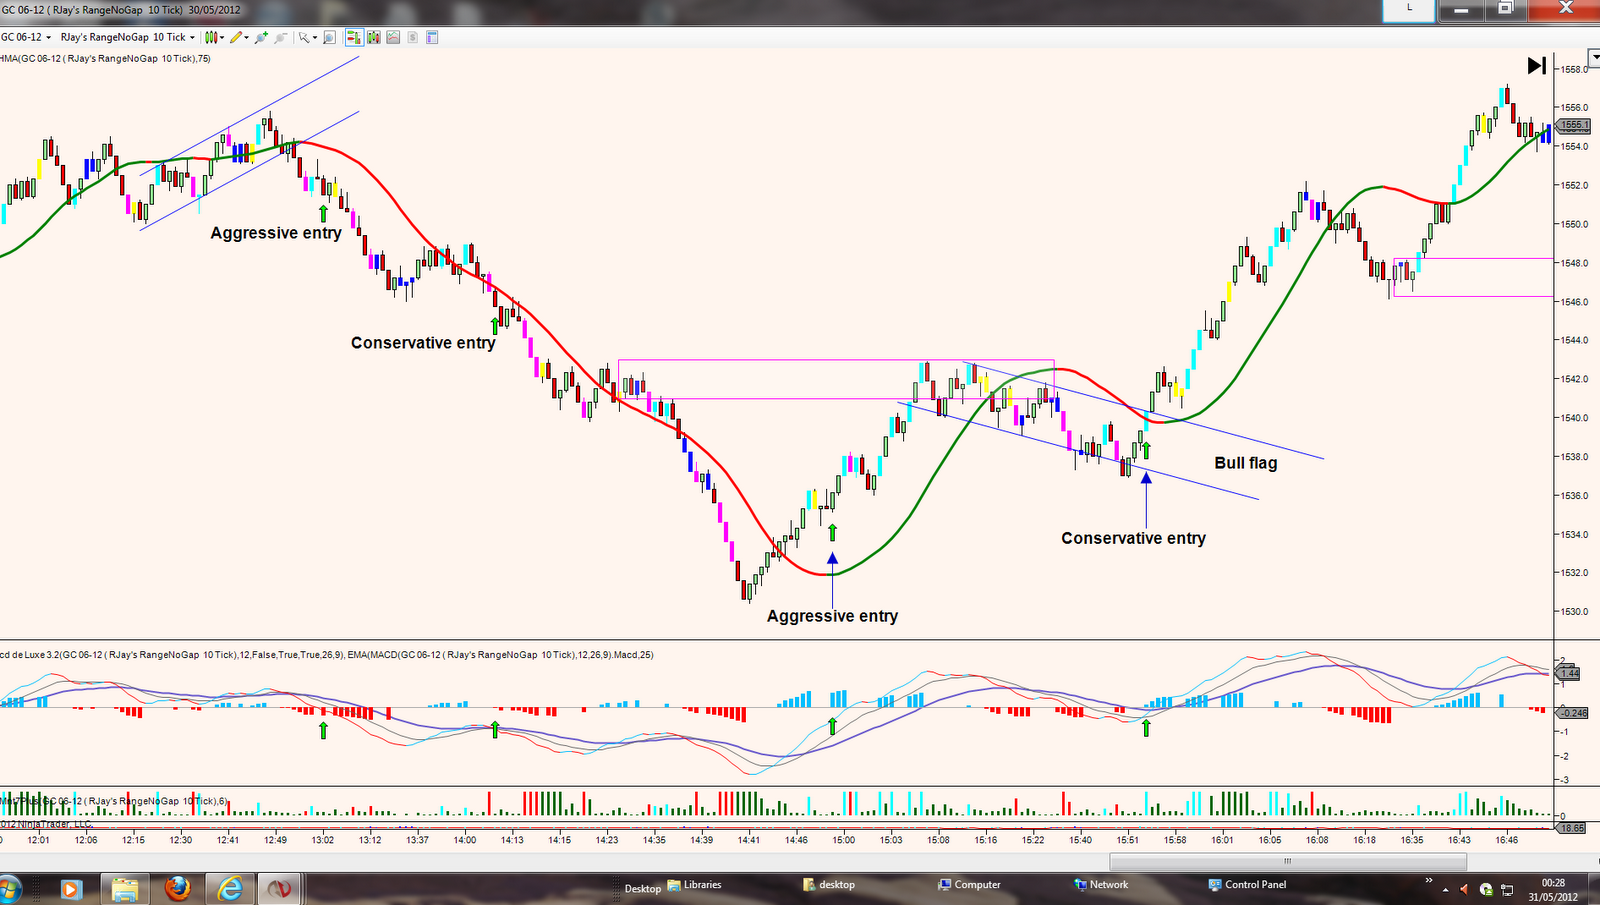
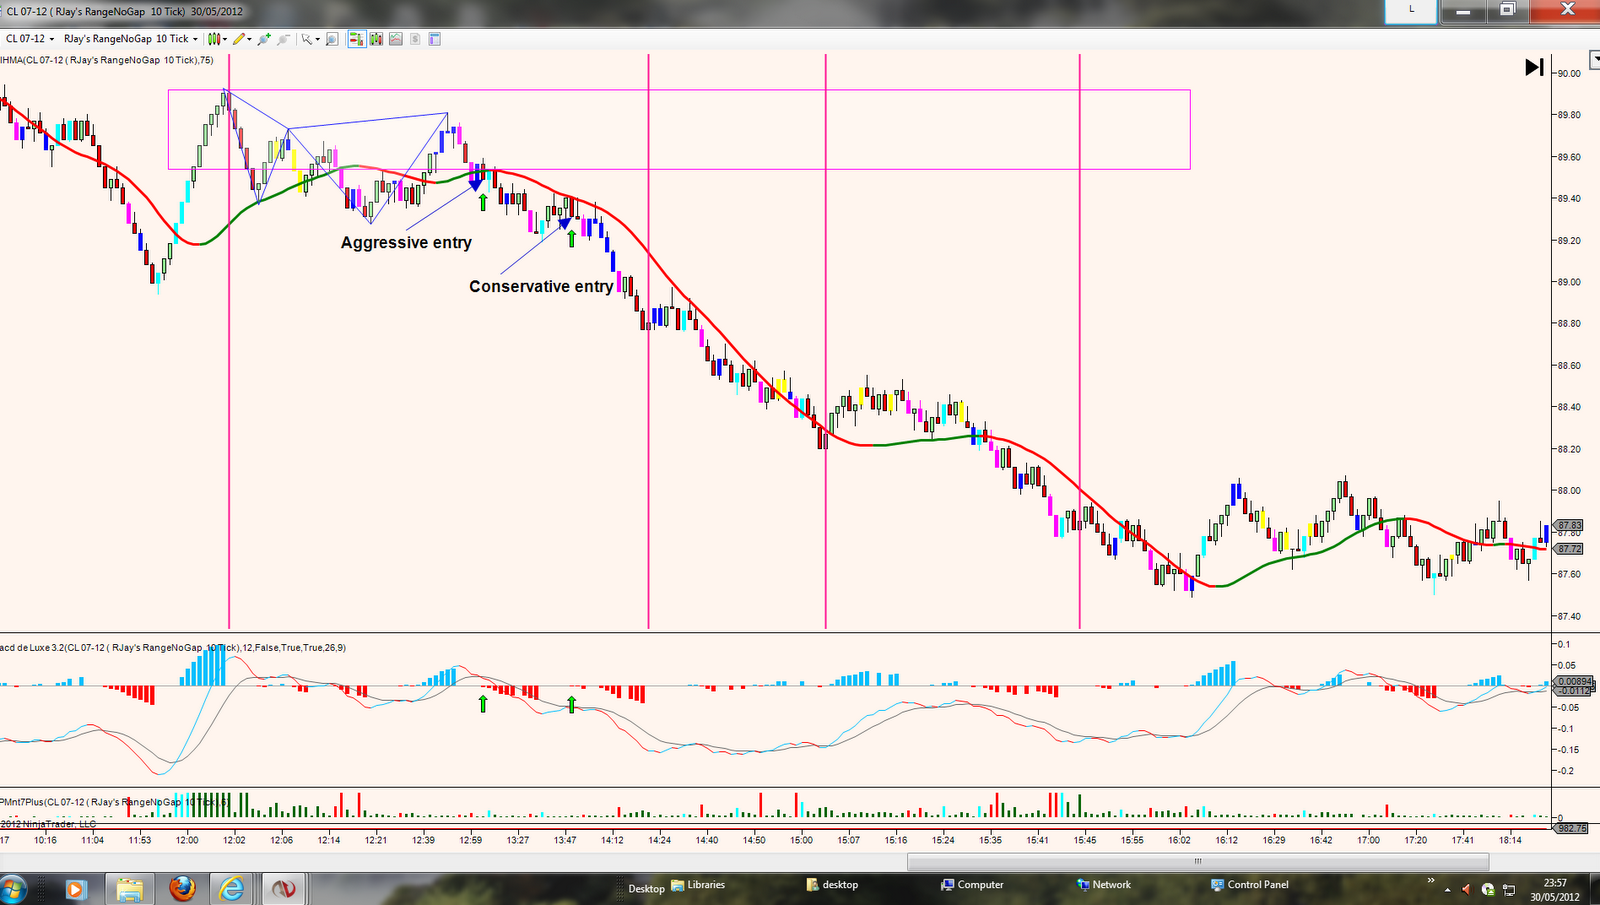
I have attached the 5 minute and 10 range charts for both Oil and Gold to show how volume affected each market differently and how to use the 10 Range and MACD to get into a reverse trade after seeing the large volume and not getting into a bad trade by anticipating a reverse after climax volume.
I have put vertical red lines on the 10 Range Oil chart to show where the large climax volume bars occurred so you can see that we did not have an impulsive counter move after the last 3 climax volume bars, so they did not offer a reverse trade unlike the first one.
Nb, I traded TF today. Had one trade with 2 positions, counter trend long after large volume on 5 min. Scaled in another position after a breakout. Scaled out of my first 2 positions at a supply zone for 37 ticks and then scaled out on my scaled in position for only 11 ticks after I saw supply returning. I should have reversed the trade when I realised that the sellers were in total control. But overall 85 ticks aggregate for all 3 positions. Not too bad.


No comments:
Post a Comment